Kodak 2001 Annual Report Download - page 80
Download and view the complete annual report
Please find page 80 of the 2001 Kodak annual report below. You can navigate through the pages in the report by either clicking on the pages listed below, or by using the keyword search tool below to find specific information within the annual report.-
 1
1 -
2
-
3
-
4
-
5
-
6
-
7
-
8
-
9
-
10
-
11
-
12
-
13
-
14
-
15
-
16
-
17
-
18
-
19
-
20
-
21
-
22
-
23
-
24
-
25
-
26
-
27
-
28
-
29
-
30
-
31
-
32
-
33
-
34
-
35
-
36
-
37
-
38
-
39
-
40
-
41
-
42
-
43
-
44
-
45
-
46
-
47
-
48
-
49
-
50
-
51
-
52
-
53
-
54
-
55
-
56
-
57
-
58
-
59
-
60
-
61
-
62
-
63
-
64
-
65
-
66
-
67
-
68
-
69
-
 70
70 -
 71
71 -
 72
72 -
 73
73 -
 74
74 -
 75
75 -
 76
76 -
 77
77 -
 78
78 -
 79
79 -
 80
80 -
 81
81 -
 82
82 -
 83
83 -
 84
84 -
 85
85 -
 86
86 -
 87
87 -
 88
88 -
 89
89 -
 90
90 -
91
-
92
-
93
-
94
-
95
-
96
-
97
-
98
-
99
-
100
-
101
-
102
-
103
-
104
-
105
-
106
-
107
-
108
-
109
-
110
-
111
-
112
-
113
-
114
-
115
-
116
-
117
-
118
 |
 |

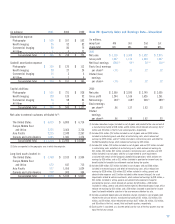
Eastman Kodak Company and Subsidiary Companies
Summary of Operating Data
(Dollar amounts and shares in millions, except per share data) 2001 2000 1999 1998 1997
Net sales $13,234 $13,994 $ 14,089 $ 13,406 $ 14,538
Earnings from operations 345 2,214 1,990 1,888 130
Net earnings 76(1) 1,407(2) 1,392(3) 1,390(4) 5(6)
Earnings and Dividends
Net earnings
—% of sales 0.6% 10.1% 9.9% 10.4% 0.0%
—% return on average shareholders’ equity 2.4% 38.3% 35.2% 38.9% 0.1%
Basic earnings per share .26 4.62 4.38 4.30 .01
Diluted earnings per share .26 4.59 4.33 4.24 .01
Cash dividends paid
—on common shares 643 545 563 569 567
—per common share 2.21 1.76 1.76 1.76 1.76
Common shares outstanding at year end 290.9 290.5 310.4 322.8 323.1
Shareholders at year end 91,893 113,308 131,719 129,495 135,132
Statement of Financial Position Data
Operational working capital(8) $863 $1,482 $ 838 $ 939 $ 909
Working capital (671) (724) (325) (579) 298
Property, plant and equipment, net 5,659 5,919 5,947 5,914 5,509
Total assets 13,362 14,212 14,370 14,733 13,145
Short-term borrowings and current portion of long-term debt 1,534 2,206 1,163 1,518 611
Long-term debt, net of current portion 1,666 1,166 936 504 585
Total shareholders’ equity 2,894 3,428 3,912 3,988 3,161
Supplemental Information
Sales — Photography $9,403 $10,231 $ 10,265 $ 10,063 $ 10,620
—Health Imaging 2,262 2,220 2,159 1,526 1,532
—Commercial Imaging 1,459 1,417 1,479 1,296 1,740
—All Other 110 126 187 521 646
Research and development costs 779 784 817 922(5) 1,230(7)
Depreciation 765 738 773 737 748
Taxes (excludes payroll,
sales and excise taxes) 154 933 806 809 164
Wages, salaries and employee benefits 3,824 3,726 3,962 4,306 4,985
Employees at year end
—in the U.S. 42,000 43,200 43,300 46,300 54,800
—worldwide 75,100 78,400 80,650 86,200 97,500
(1) Includes $678 million of restructuring charges; $42 million for a charge related to asset impairments associated with certain of the Company’s photofinishing operations; $15 million for
asset impairments related to venture investments; $41 million for a charge for environmental reserves; $77 million for the Wolf bankruptcy; a $20 million charge for the Kmart bankruptcy;
$18 million of relocation charges related to the sale and exit of a manufacturing facility; an $11 million tax benefit related to a favorable tax settlement; and a $20 million tax benefit
representing a decline in the year-over-year effective tax rate. These items reduced net earnings by $594 million.
(2) Includes accelerated depreciation and relocation charges related to the sale and exit of a manufacturing facility of $50 million, which reduced net earnings by $33 million.
(3) Includes $350 million of restructuring charges, and an additional $11 million of charges related to this restructuring program; $103 million of charges associated with business exits; a
gain of $95 million on the sale of The Image Bank; and a gain of $25 million on the sale of the Motion Analysis Systems Division. These items reduced net earnings by $227 million.
(4) Includes $35 million of litigation charges; $132 million of Office Imaging charges; $45 million primarily for a write-off of in-process R&D associated with the Imation acquisition; a gain of
$87 million on the sale of NanoSystems; and a gain of $66 million on the sale of part of the Company’s investment in Gretag. These items reduced net earnings by $39 million.
(5) Includes a $42 million charge for the write-off of in-process R&D associated with the Imation acquisition.
(6) Includes $1,455 million of restructuring costs, asset impairments and other charges; $186 million for a write-off of in-process R&D associated with the Wang acquisition; and a $46 million
litigation charge. These items reduced net earnings by $1,143 million.
(7) Includes a $186 million charge for the write-off of in-process R&D associated with the Wang acquisition.
(8) Excludes short-term borrowings and current portion of long-term debt.
78