Kodak 2001 Annual Report Download - page 61
Download and view the complete annual report
Please find page 61 of the 2001 Kodak annual report below. You can navigate through the pages in the report by either clicking on the pages listed below, or by using the keyword search tool below to find specific information within the annual report.-
 1
1 -
2
-
3
-
4
-
5
-
6
-
7
-
8
-
9
-
10
-
11
-
12
-
13
-
14
-
15
-
16
-
17
-
18
-
19
-
20
-
21
-
22
-
23
-
24
-
25
-
26
-
27
-
28
-
29
-
30
-
31
-
32
-
33
-
34
-
35
-
36
-
37
-
38
-
39
-
40
-
41
-
42
-
43
-
44
-
45
-
46
-
47
-
48
-
49
-
50
-
 51
51 -
 52
52 -
 53
53 -
 54
54 -
 55
55 -
 56
56 -
 57
57 -
 58
58 -
 59
59 -
 60
60 -
 61
61 -
 62
62 -
 63
63 -
 64
64 -
 65
65 -
 66
66 -
 67
67 -
 68
68 -
 69
69 -
 70
70 -
 71
71 -
72
-
73
-
74
-
75
-
76
-
77
-
78
-
79
-
80
-
81
-
82
-
83
-
84
-
85
-
86
-
87
-
88
-
89
-
90
-
91
-
92
-
93
-
94
-
95
-
96
-
97
-
98
-
99
-
100
-
101
-
102
-
103
-
104
-
105
-
106
-
107
-
108
-
109
-
110
-
111
-
112
-
113
-
114
-
115
-
116
-
117
-
118
 |
 |

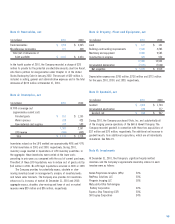
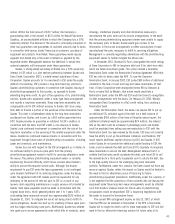
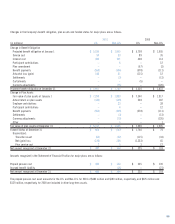
Note 2: Receivables, net
(in millions) 2001 2000
Trade receivables $1,966 $2,245
Miscellaneous receivables 371 408
Total (net of allowances of
$109 and $89) $2,337 $2,653
In the fourth quarter of 2001, the Company recorded a charge of $20
million to provide for the potential uncollectible amounts due from Kmart,
who filed a petition for reorganization under Chapter 11 of the United
States Bankruptcy Code in January 2002. The amount of $20 million is
included in selling, general and administrative expenses and in the total
allowance of $109 million at December 31, 2001.
Note 3: Inventories, net
(in millions) 2001 2000
At FIFO or average cost
(approximates current cost)
Finished goods $851 $1,155
Work in process 318 423
Raw materials and supplies 412 589
1,581 2,167
LIFO reserve (444) (449)
Total $1,137 $1,718
Inventories valued on the LIFO method are approximately 48% and 47%
of total inventories in 2001 and 2000, respectively. During 2001,
inventory usage resulted in liquidations of LIFO inventory quantities. In
the aggregate, these inventories were carried at the lower costs
prevailing in prior years as compared with the cost of current purchases.
The effect of these LIFO liquidations was to reduce cost of goods sold by
$14 million in 2001. No LIFO layer liquidations occurred in 2000 or 1999.
The Company provides for potentially excess, obsolete or slow-
moving inventory based on management’s analysis of inventory levels
and future sales forecasts. The Company also provides for inventories
whose cost is in excess of market. At December 31, 2001 and 2000,
aggregate excess, obsolete, slow-moving and lower of cost or market
reserves were $99 million and $96 million, respectively.
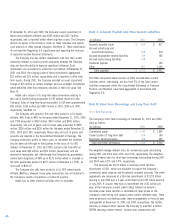
Note 4: Property, Plant and Equipment, net
(in millions) 2001 2000
Land $127 $141
Buildings and building improvements 2,602 2,285
Machinery and equipment 9,884 9,585
Construction in progress 369 952
12,982 12,963
Accumulated depreciation (7,323) (7,044)
Net properties $5,659 $5,919
Depreciation expense was $765 million, $738 million and $773 million
for the years 2001, 2000, and 1999, respectively.
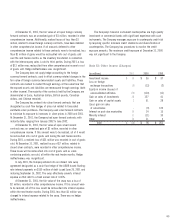
Note 5: Goodwill, net
(in millions) 2001 2000
Goodwill $1,868 $1,724
Accumulated amortization 920 777
Goodwill, net $948 $947
During 2001, the Company purchased Ofoto, Inc. and substantially all
of the imaging service operations of the Bell & Howell Company. The
Company recorded goodwill in connection with these two acquisitions of
$37 million and $70 million, respectively. The additional net increase in
goodwill results from additional acquisitions, which are all individually
immaterial. See Note 19.
Note 6: Investments
At December 31, 2001, the Company’s significant equity method
investees and the Company’s approximate ownership interest in each
investee were as follows:
Kodak Polychrome Graphics (KPG) 50%
NexPress Solutions LLC 50%
Phogenix Imaging LLC 50%
Matsushita-Ultra Technologies
Battery Corporation 30%
Express Stop Financing (ESF) 50%
SK Display Corporation 34%
59