Kodak 2001 Annual Report Download - page 38
Download and view the complete annual report
Please find page 38 of the 2001 Kodak annual report below. You can navigate through the pages in the report by either clicking on the pages listed below, or by using the keyword search tool below to find specific information within the annual report.-
 1
1 -
2
-
3
-
4
-
5
-
6
-
7
-
8
-
9
-
10
-
11
-
12
-
13
-
14
-
15
-
16
-
17
-
18
-
19
-
20
-
21
-
22
-
23
-
24
-
25
-
26
-
27
-
 28
28 -
 29
29 -
 30
30 -
 31
31 -
 32
32 -
 33
33 -
 34
34 -
 35
35 -
 36
36 -
 37
37 -
 38
38 -
 39
39 -
 40
40 -
 41
41 -
 42
42 -
 43
43 -
 44
44 -
 45
45 -
 46
46 -
 47
47 -
 48
48 -
49
-
50
-
51
-
52
-
53
-
54
-
55
-
56
-
57
-
58
-
59
-
60
-
61
-
62
-
63
-
64
-
65
-
66
-
67
-
68
-
69
-
70
-
71
-
72
-
73
-
74
-
75
-
76
-
77
-
78
-
79
-
80
-
81
-
82
-
83
-
84
-
85
-
86
-
87
-
88
-
89
-
90
-
91
-
92
-
93
-
94
-
95
-
96
-
97
-
98
-
99
-
100
-
101
-
102
-
103
-
104
-
105
-
106
-
107
-
108
-
109
-
110
-
111
-
112
-
113
-
114
-
115
-
116
-
117
-
118
 |
 |

36
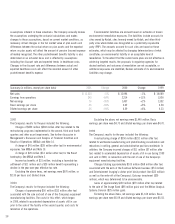
exchange. Sales in emerging markets increased 7% in 2000 as compared
with 1999.
Net worldwide sales of digital products (including laser printers,
digital media, digital capture equipment and PACS), increased 11% in
2000 as compared with 1999. The increase in sales of digital products in
2000 as compared with 1999 was driven by a 67% increase in DryView
laser imager placements, a 48% increase in DryView media due to higher
volumes, a 120% increase in digital capture products and a 25%
increase in PACS. The growth in sales from these product groups was
partially offset by the expected decline in wet laser imaging sales.
Sales of the Company’s traditional medical products, including
analog film, equipment, chemistry and services, declined 3%. Within the
Company’s traditional products, traditional analog film products
(excluding Mammography and Oncology and Dental products) decreased
7%, reflecting flat volumes, unfavorable exchange and anticipated price
declines. Also within the Company’s traditional products, Mammography
and Oncology specialty product sales increased 12% in 2000 as
compared with 1999, reflecting higher volumes. Sales of traditional
Dental products increased 5% over the same period due to slightly
higher volumes and favorable pricing.
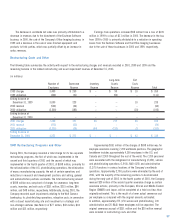
The gross profit margin for the Health Imaging segment was
relatively flat at 46.6% in 2000 as compared with 47.1% in 1999.
SG&A expenses decreased 7% in 2000 as compared with 1999. As a
percentage of sales, SG&A decreased from 17.5% in 1999 to 15.8% in
2000, reflecting the benefits of cost-control initiatives and the continued
successful integration of the Imation business acquired in December
1998. R&D expenses increased 5% in 2000 as compared with 1999. As a
percentage of sales, R&D increased slightly from 6.1% in 1999 to 6.2%
in 2000.
Earnings from operations increased $35 million, or 7%, from $483
million in 1999 to $518 million in 2000, which is attributable to
increased sales, a consistent gross profit margin percentage year-over-
year, and a decrease in SG&A expenses, which more than offset the
increase in R&D spending. Net earnings increased $32 million, or 10%,
from $324 million in 1999 to $356 million in 2000.
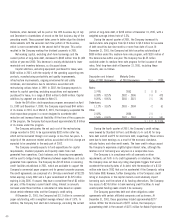
Commercial Imaging Net worldwide sales for the Commercial Imaging
segment were $1,417 million for 2000 as compared with $1,479 million
for 1999, representing a decrease of $62 million, or 4% as reported, or
1% excluding the negative impact of exchange. Net sales in the U.S.
were $715 million for 2000 as compared with $741 million for 1999,
representing a decrease of $26 million, or 4%. Net sales outside the U.S.
were $702 million for 2000 as compared with $738 million for 1999,
representing a decrease of $36 million, or 5% as reported, or flat sales
excluding the negative impact of exchange.
Net worldwide sales in the Company’s digital imaging equipment
and services product groups decreased 5% in 2000 as compared with
1999. The decrease in sales was primarily attributable to a decrease in
revenues in the traditional equipment and media product groups,
reflecting lower volumes.
Net worldwide sales in the Company’s commercial and government
product groups increased 26% in 2000 as compared with 1999. The
increase in sales was principally due to increased revenues under its
government contracts.
Net worldwide sales for wide-format inkjet products increased 63%
in 2000 as compared with 1999, as the Company continued its efforts to
improve its position in this market.
Net worldwide sales of graphic arts products to KPG decreased 23%
in 2000 as compared with 1999. With decreases in sales of all product
groups sold to KPG, including film, equipment, paper, digital media and
chemicals, the largest contributor to this decline in sales was graphics
film, which decreased 30%. The decrease in sales to KPG is attributable
to KPG’s ongoing inventory re-balancing efforts, which is part of an
overall process improvement program within the joint venture. The joint
venture has begun to realize some of the benefits from the capacity
consolidation, workforce reductions, infrastructure realignment, and other
process improvements started earlier in 2000. The Company is the
exclusive provider of graphic arts products to KPG.
Net worldwide sales of products to NexPress were flat in 2000 as
compared with 1999, and immaterial to the Company.
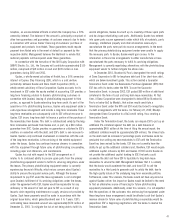
The gross profit margin for the Commercial Imaging segment was
33.4% in 2000 as compared with 35.0% in 1999. The 1.6 percentage point
decrease in gross margin is primarily attributable to lower selling prices
and adverse currency movements.
SG&A expenses increased 5% in 2000 as compared with 1999. As a
percentage of sales, SG&A increased from 11.4% in 1999 to 12.4% in
2000. R&D expenses decreased 31% in 2000 as compared with 1999. As a
percentage of sales, R&D decreased from 5.9% in 1999 to 4.3% in 2000.
Earnings from operations decreased $24 million, or 9%, from $257
million in 1999 to $233 million in 2000, which is attributable to the
slight decrease in the gross profit margin percentage and an increase in
SG&A expenses in 2000 as compared with 1999, as described above. Net
earnings decreased $88 million, or 49%, from $178 million in 1999 to
$90 million in 2000. The decrease in net earnings is primarily
attributable to lower earnings from operations and the Company’s equity
in the losses of KPG and NexPress.
All Other Net worldwide sales for All Other were $126 million for 2000 as
compared with $186 million for 1999, representing a decrease of $60
million, or 32% as reported, or 31% excluding the negative impact from
exchange. Net sales in the U.S. were $68 million for 2000 as compared
with $113 million for 1999, representing a decrease of $45 million, or
40%, while net sales outside the U.S. were $58 million for 2000 as
compared with $73 million for 1999, representing a decrease of $15
million, or 21% as reported, or 18% excluding the negative impact of
exchange.