Kodak 2001 Annual Report Download - page 79
Download and view the complete annual report
Please find page 79 of the 2001 Kodak annual report below. You can navigate through the pages in the report by either clicking on the pages listed below, or by using the keyword search tool below to find specific information within the annual report.-
 1
1 -
2
-
3
-
4
-
5
-
6
-
7
-
8
-
9
-
10
-
11
-
12
-
13
-
14
-
15
-
16
-
17
-
18
-
19
-
20
-
21
-
22
-
23
-
24
-
25
-
26
-
27
-
28
-
29
-
30
-
31
-
32
-
33
-
34
-
35
-
36
-
37
-
38
-
39
-
40
-
41
-
42
-
43
-
44
-
45
-
46
-
47
-
48
-
49
-
50
-
51
-
52
-
53
-
54
-
55
-
56
-
57
-
58
-
59
-
60
-
61
-
62
-
63
-
64
-
65
-
66
-
67
-
68
-
 69
69 -
 70
70 -
 71
71 -
 72
72 -
 73
73 -
 74
74 -
 75
75 -
 76
76 -
 77
77 -
 78
78 -
 79
79 -
 80
80 -
 81
81 -
 82
82 -
 83
83 -
 84
84 -
 85
85 -
 86
86 -
 87
87 -
 88
88 -
 89
89 -
90
-
91
-
92
-
93
-
94
-
95
-
96
-
97
-
98
-
99
-
100
-
101
-
102
-
103
-
104
-
105
-
106
-
107
-
108
-
109
-
110
-
111
-
112
-
113
-
114
-
115
-
116
-
117
-
118
 |
 |

77
(in millions) 2001 2000 1999
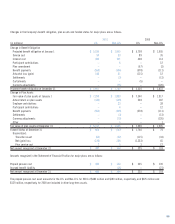
Depreciation expense:
Photography $599 $557 $ 592
Health Imaging 96 92 82
Commercial Imaging 69 80 76
All Other 1923
Consolidated total $765 $738 $ 773
Goodwill amortization expense:
Photography $110 $120 $ 113
Health Imaging 28 27 24
Commercial Imaging 16 34
All Other 01 4
Consolidated total $154 $ 151 $ 145
Capital additions:
Photography $ 555 $ 721 $ 938
Health Imaging 128 120 92
Commercial Imaging 56 98 84
All Other 4613
Consolidated total $743 $945 $ 1,127
Net sales to external customers attributed to(2):
The United States $6,419 $6,800 $ 6,714
Europe, Middle East
and Africa 3,275 3,464 3,734
Asia Pacific 2,215 2,349 2,267
Canada and Latin America 1,325 1,381 1,374
Consolidated total $13,234 $13,994 $ 14,089
(2) Sales are reported in the geographic area in which they originate.
Long-lived assets located in:
The United States $3,738 $3,913 $ 3,904
Europe, Middle East
and Africa 672 647 715
Asia Pacific 977 1,056 1,024
Canada and Latin America 272 303 304
Consolidated total $5,659 $5,919 $ 5,947
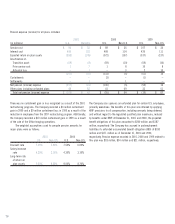
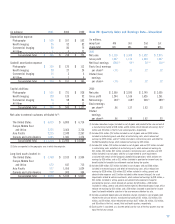
Note 22: Quarterly Sales and Earnings Data—Unaudited
(in millions,
except per 4th 3rd 2nd 1st
share data) Qtr. Qtr. Qtr. Qtr.
2001
Net sales $3,359 $ 3,308 $ 3,592 $ 2,975
Gross profit 1,027 1,132 1,338 1,067
Net (loss) earnings (206)(4) 96(3) 36(1,2) 150(1)
Basic (loss) earnings
per share(6) (.71) .33 .12 .52
Diluted (loss)
earnings
per share(6) (.71) .33 .12 .52
2000
Net sales $ 3,560 $ 3,590 $ 3,749 $ 3,095
Gross profit 1,244 1,516 1,626 1,261
Net earnings 194(5) 418(5) 506(5) 289(5)
Basic earnings
per share(6) .66 1.37 1.63 .93
Diluted
earnings
per share(6) .66 1.36 1.62 .93
(1) Includes relocation charges (included in cost of goods sold) related to the sale and exit of
a manufacturing facility of $10 million and $8 million, which reduced net earnings by $7
million and $5 million in the first and second quarters, respectively.
(2) Includes $316 million ($57 million included in cost of goods sold and $259 million
included in restructuring costs and other) of restructuring costs, which reduced net
earnings by $232 million; and $77 million (included in restructuring costs and other) for
the Wolf bankruptcy charge, which reduced net earnings by $52 million.
(3) Includes $53 million ($41 million included in cost of goods sold and $12 million included
in restructuring costs and other) of restructuring costs, which reduced net earnings by
$41 million; $42 million ($23 million included in restructuring costs and other and $19
million included in cost of goods sold) for a charge related to asset impairments
associated with certain of the Company’s photofinishing operations, which reduced net
earnings by $26 million; and an $11 million (included in provision for income taxes) tax
benefit related to favorable tax settlements reached during the quarter.
(4) Includes $309 million ($21 million included in cost of goods sold and $288 million
included in restructuring costs and other) of restructuring costs, which reduced net
earnings by $210 million; $15 million ($12 million included in selling, general and
administrative expenses and $3 million included in other income (charges)) for asset
impairments related to venture investments, which reduced net earnings by $10 million; a
$41 million (included in selling, general and administrative expenses) charge for
environmental reserves, which reduced net earnings by $28 million; a $20 million
(included in selling, general and administrative expenses) Kmart bankruptcy charge, which
reduced net earnings by $14 million, and a $20 million (included in provision for income
taxes) tax benefit related to a decline in the year-over-year effective tax rate.
(5) Includes accelerated depreciation and relocation charges (included in cost of goods sold)
related to the sale and exit of a manufacturing facility of $11 million, $12 million, $18
million, and $9 million, which reduced net earnings by $7 million, $8 million, $12 million,
and $6 million in the first, second, third and fourth quarters, respectively.
(6) Each quarter is calculated as a discrete period and the sum of the four quarters may not
equal the full year amount.