Kodak 2001 Annual Report Download - page 31
Download and view the complete annual report
Please find page 31 of the 2001 Kodak annual report below. You can navigate through the pages in the report by either clicking on the pages listed below, or by using the keyword search tool below to find specific information within the annual report.-
 1
1 -
2
-
3
-
4
-
5
-
6
-
7
-
8
-
9
-
10
-
11
-
12
-
13
-
14
-
15
-
16
-
17
-
18
-
19
-
20
-
 21
21 -
 22
22 -
 23
23 -
 24
24 -
 25
25 -
 26
26 -
 27
27 -
 28
28 -
 29
29 -
 30
30 -
 31
31 -
 32
32 -
 33
33 -
 34
34 -
 35
35 -
 36
36 -
 37
37 -
 38
38 -
 39
39 -
 40
40 -
 41
41 -
42
-
43
-
44
-
45
-
46
-
47
-
48
-
49
-
50
-
51
-
52
-
53
-
54
-
55
-
56
-
57
-
58
-
59
-
60
-
61
-
62
-
63
-
64
-
65
-
66
-
67
-
68
-
69
-
70
-
71
-
72
-
73
-
74
-
75
-
76
-
77
-
78
-
79
-
80
-
81
-
82
-
83
-
84
-
85
-
86
-
87
-
88
-
89
-
90
-
91
-
92
-
93
-
94
-
95
-
96
-
97
-
98
-
99
-
100
-
101
-
102
-
103
-
104
-
105
-
106
-
107
-
108
-
109
-
110
-
111
-
112
-
113
-
114
-
115
-
116
-
117
-
118
 |
 |

29
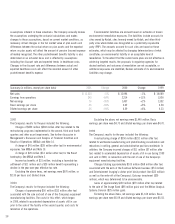
Detailed Results of Operations
Net Sales by Reportable Segment and All Other (in millions) 2001 Change 2000 Change 1999
Photography
Inside the U.S. $4,482 –10% $4,960 +4% $ 4,756
Outside the U.S. 4,921 –7% 5,271 –4% 5,509
Total Photography 9,403 –8% 10,231 0% 10,265
Health Imaging
Inside the U.S. 1,089 +2% 1,067 +8% 984
Outside the U.S. 1,173 +2% 1,153 –2% 1,175
Total Health Imaging 2,262 +2% 2,220 +3% 2,159
Commercial Imaging
Inside the U.S. 820 +15% 715 –4% 741
Outside the U.S. 639 –9% 702 –5% 738
Total Commercial Imaging 1,459 +3% 1,417 –4% 1,479
All Other
Inside the U.S. 68 0% 68 –40% 113
Outside the U.S. 42 –28% 58 –21% 73
Total All Other 110 –13% 126 –32% 186
Total Net Sales $13,234 –5% $13,994 –1% $ 14,089
Earnings from Operations by Reportable Segment and All Other (in millions)
Photography $787 –45% $1,430 –16% $ 1,709
Health Imaging 323 –38% 518 +7% 483
Commercial Imaging 165 –29% 233 –9% 257
All Other (60) (11) (109)
Total of segments 1,215 –44% 2,170 –7% 2,340
Restructuring costs and credits and asset impairments (732) 44 (350)
Wolf charge (77) ––
Environmental reserve (41) ––
Kmart charge (20) ––
Consolidated total $345 –84% $2,214 +11% $ 1,990
Net Earnings by Reportable Segment and All Other (in millions)
Photography $535 –48% $1,034 –18% $ 1,261
Health Imaging 221 –38% 356 +10% 324
Commercial Imaging 80 –11% 90 –49% 178
All Other (38) (2) (61)
Total of segments 798 –46% 1,478 –13% 1,702
Restructuring costs and credits and asset impairments (735) 44 (350)
Wolf charge (77) ––
Environmental reserve (41) ––
Kmart charge (20) ––
Interest expense (219) (178) (142)
Other corporate items 826 22
Income tax effects on above items and taxes
not allocated to segments 362 37 160
Consolidated total $76 –95% $1,407 +1% $ 1,392