JCPenney 2004 Annual Report Download - page 8
Download and view the complete annual report
Please find page 8 of the 2004 JCPenney annual report below. You can navigate through the pages in the report by either clicking on the pages listed below, or by using the keyword search tool below to find specific information within the annual report.
J.C. PENNEY COMPANY, INC.2 004 ANNUAL REPORT
Management’s Discussion and Analysis of Financial Condition and Results of Operations
6
MANAGEMENT’S DISCUSSION AND
ANALYSIS OF FINANCIAL CONDITION
AND RESULTS OF OPERATIONS
The following discussion, which presents the results of J. C.
Penney Company, Inc. and its subsidiaries (the Company or
JCPenney), should be read in conjunction with the accompanying
consolidated financial statements and notes thereto beginning on
page 25, along with the unaudited Five-Year Financial and
Operations Summary on page 49.
Certain debt securities were issued by J. C. Penney Corporation,
Inc. (JCP), the wholly owned operating subsidiary of the Company.
The Company is a co-obligor (or guarantor, as appropriate) regard-
ing the payment of principal and interest on JCP’s oustanding debt
securities. The guarantee by the Company of certain of JCP’s out-
standing debt securities is full and unconditional.
CORPORATE GOVERNANCE AND FINANCIAL REPORTING
The Company remains committed to both maintaining the high-
est level of corporate governance and continuously increasing the
transparency of its financial reporting, providing stockholders with
informative financial disclosures and presenting an accurate view
of the Company’s financial position and operating results.
While the Company has always focused on excellence in corpo-
rate governance, management has continued to strengthen its
well-established programs and policies, including the implementa-
tion of a reporting matrix that requires written certifications from a
cross-discipline team of more than 20 key members of manage-
ment who have responsibility for verifying and reporting corporate
results.
For its 2004 Annual Report, the Company continued the trend of
providing transparent financial reporting, with enhanced disclo-
sures related to the Company’s financial condition and cash flows,
its credit rating outlook and the ongoing repositioning of its capital
structure, as well as a detailed discussion of the impact of the
Eckerd disposition and related contingencies. Additionally, for the
first time in 2004, the Company was required to report on the effec-
tiveness of its internal control over financial reporting under the
requirements of Section 404 of the Sarbanes-Oxley Act of 2002
(Sarbanes-Oxley Act). In relation to these requirements, the
Company’s external auditors expressed an unqualified opinion on
management’s assessment of, and the effective operation of, the
Company’s internal control over financial reporting.
EXECUTIVE OVERVIEW
2004 Accomplishments
Sustained Sales Growth
— Comparable department store sales
increased 5.0%, representing the fourth consecutive year of
improvement. Catalog/Internet sales increased 1.5% in 2004 (3.3%
excluding $46 million of sales for the 53rd week of 2003), the sec-
ond year in a row of sales gains. Internet, the fastest growing sales
channel, increased approximately 32% (34% excluding the 53rd
week of 2003). Internet sales now represent almost 30% of total
Catalog/Internet sales.
Improved Profitability
— Operating profit for 2004 increased
270 basis points to 7.1% of sales. With this improvement, the
Company achieved its turnaround objective of 6% to 8% operating
profit one year ahead of schedule. Strong sales growth, continued
improvements in gross margin and expense leverage contributed to
this significant accomplishment.
Income from continuing operations for 2004 increased 83% to
$667 million, when compared to 2003. Diluted earnings per share
(EPS) from continuing operations of $2.23 for 2004 improved 84%
compared to $1.21 in 2003.
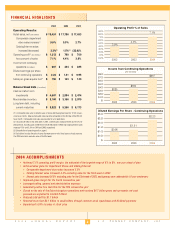
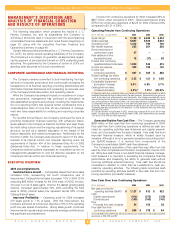
Operating Results from Continuing Operations
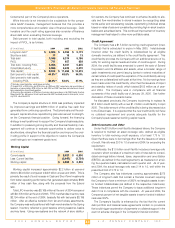
($ in millions, except EPS)
2004 2003 2002
Gross margin
$ 7,139 $ 6,620 $ 6,334
SG&A expenses
5,827 5,830 5,634
Operating profit(1)
1,312 790 700
Net interest expense
233 261 226
Bond premiums and
unamortized costs
47 – –
Real estate and other
expense/(income)
12 (17) 59
Income from continuing
operations before income taxes
1,020 546 415
Income tax expense
353 182 130
Income from
continuing operations
$667 $ 364 $ 285
Diluted earnings per share
from continuing operations
$2.23 $ 1.21 $ 0.95
Comparable department
store sales(2) increase
5.0% 0.9% 2.7%
Catalog/Internet sales
increase/(decrease)
3.3%(3) 1.5%(3) (22.0)%
(1) Operating profit and its components (sales, gross margin and SG&A) are key measurements on which
management evaluates the financial performance of the retail operations. Real estate activities, gains and
losses on the sale of real estate properties, asset impairments, other charges associated with closing
store and catalog facilities and senior management transition costs are evaluated separately from opera-
tions and are recorded in Real Estate and Other in the Consolidated Statements of Operations.
(2) Comparable store sales include the sales of stores after having been open for 12 full consecutive fis-
cal months. New and relocated stores become comparable on the first day of the 13th full fiscal month.
Comparable store sales are presented on a 52-week basis. In 2003, Department Store sales for the 53rd
week were $152 million.
(3) Excludes the effect of the 53rd week in 2003. Internet sales increased 34.0% and 47.8% for those
periods. Including sales of $46 million for the 53rd week in 2003, total Catalog/Internet sales increased
1.5% and 3.3% for 2004 and 2003, respectively.
Generated Positive Free Cash Flow
— The Company generated
$599 million of free cash flow from continuing operations in 2004.
Free cash flow from continuing operations is defined as cash pro-
vided by operating activities less dividends and capital expendi-
tures, net of proceeds from the sale of assets. Free cash flow is an
important financial measure, which is widely focused upon by
investors. Although it is not a generally accepted accounting princi-
ple (GAAP) measure, it is derived from components of the
Company’s consolidated GAAP cash flow statement.
The Company’s calculation of free cash flow may differ from that
used by other companies and therefore comparability may be limit-
ed. While free cash flow is a non-GAAP financial measure, manage-
ment believes it is important in evaluating the Company’s financial
performance and measuring the ability to generate cash without
incurring additional external financing. Free cash flow should be
considered in addition to, rather than as a substitute for, cash pro-
vided by operating activities. The following table reconciles cash
provided by operating activities (GAAP) to free cash flow from con-
tinuing operations (non-GAAP measure):
Free Cash Flow from Continuing Operations
($ in millions)
2004 2003 2002
Net cash provided by
operating activities (GAAP)(1)
$1,127 $ 812 $ 522
Less:
Capital expenditures
(412) (373) (315)
Dividends paid
(150) (160) (161)
Plus:
Proceeds from sale of assets
34 100 38
Free cash flow from
continuing operations
$ 599 $ 379 $ 84
(1) Includes $300 million ($190 million after tax) discretionary cash contributions to the Company’s qualified
pension plan in 2004, 2003 and 2002.


