JCPenney 2004 Annual Report Download - page 45
Download and view the complete annual report
Please find page 45 of the 2004 JCPenney annual report below. You can navigate through the pages in the report by either clicking on the pages listed below, or by using the keyword search tool below to find specific information within the annual report.-
 1
1 -
2
-
3
-
4
-
5
-
6
-
7
-
8
-
9
-
10
-
11
-
12
-
13
-
14
-
15
-
16
-
17
-
18
-
19
-
20
-
21
-
22
-
23
-
24
-
25
-
26
-
27
-
28
-
29
-
30
-
31
-
32
-
33
-
34
-
 35
35 -
 36
36 -
 37
37 -
 38
38 -
 39
39 -
 40
40 -
 41
41 -
 42
42 -
 43
43 -
 44
44 -
 45
45 -
 46
46 -
 47
47 -
 48
48 -
 49
49 -
 50
50 -
 51
51 -
 52
52 -
 53
53 -
 54
54 -
 55
55 -
56
 |
 |

J.C. PENNEY COMPANY, INC.2 004 ANNUAL REPORT
Notes to the Consolidated Financial Statements
43
strong return on plan assets in 2003 and continued improvement in
2004, this surplus increased to $221 million at the 2003 measure-
ment date and $270 million at the 2004 measurement date.
Aminimum liability adjustment for the supplemental retirement
plans was required again in 2004 due to the ABO exceeding the
recorded liability. In addition to the accrued liability for the supple-
mental retirement plans, the additional minimum liability balance
was $169 million and $134 million in 2004 and 2003, respectively.
Of the $169 million balance for 2004, approximately $1 million was
reflected as an intangible asset due to unrecognized prior service
cost. For the remaining increase from the prior year, a charge was
recorded to stockholders’ equity, net of income tax benefits, as a
component of other comprehensive loss in the amount of approxi-
mately $20 million. This adjustment does not impact current year
earnings or the funding requirements of the plan. See the
Consolidated Statements of Stockholders’ Equity for the charge
included in Other Comprehensive Income for each year.
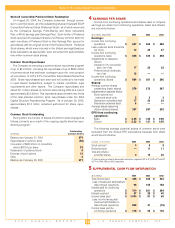
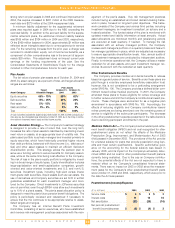
Plan Assets
The fair value of pension plan assets as of October 31, 2004 and
2003, by asset category as a percent of total, and target allocation
ranges are as follows:
Plan Assets
Target October 31, October 31,
Asset Category Allocation Ranges 2004 2003
Equity securities
65% - 75% 65% 62%
(1)
Debt securities
15% - 25% 20% 20%
Real estate
5% - 15% 9% 9%
Cash and other(1)
0% - 5% 6% 9%
Total
100% 100%
(1) Cash investments exceeded the targeted range at both October 31, 2004 and 2003, and equity secu-
rities were less than the targeted range temporarily at October 31, 2003, due to the timing of contribu-
tions relative to investments made in equity and fixed income securities.
Asset Allocation Strategy
—
The Company’s investment strategy
is designed to provide a rate of return that, over the long term,
increases the ratio of plan assets to liabilities by maximizing invest-
ment return on assets, at an appropriate level of volatility risk. The
plan’s asset portfolio is actively managed and invested primarily in
equity securities, which have historically provided higher returns
than debt portfolios, balanced with fixed income (i.e., debt securi-
ties) and other asset classes to maintain an efficient risk/return
diversification profile. This strategy allows the pension plan to
serve as a funding vehicle to secure benefits for Company associ-
ates, while at the same time being cost effective to the Company.
The risk of loss in the plan’s equity portfolio is mitigated by invest-
ing in a broad range of equity types. Equity diversification includes
large-capitalization and small-capitalization companies, growth-
oriented and value-oriented investments and U.S. and non-U.S.
securities. Investment types, including high-yield versus invest-
ment-grade debt securities, illiquid assets such as real estate, the
use of derivatives and Company securities are set forth in written
guidelines established for each investment manager and moni-
tored by the Company. Direct investments in JCPenney securities
are not permitted, even though ERISA rules allow such investments
up to 10% of a plan’s assets. The plan’s asset allocation policy is
designed to meet the plan’s future pension benefit obligations. The
policy is periodically reviewed and rebalanced if necessary to
ensure that the mix continues to be appropriate relative to estab-
lished targets and ranges.
The Company has an internal Benefit Plans Investment
Committee, consisting of senior executives, who have established
and oversee risk management practices associated with the man-
agement of the plan’s assets. Key risk management practices
include having an established and broad decision-making frame-
work in place, focused on long-term plan objectives. This frame-
work consists of the Company and various third parties, including
investment managers, an investment consultant, an actuary and a
trustee/custodian. The funded status of the plan is monitored with
updated market and liability information at least annually. Actual
asset allocations are monitored monthly and rebalancing actions
are executed at least quarterly, if needed. To manage the risk
associated with an actively managed portfolio, the Company
reviews each manager’s portfolio on a quarterly basis and has writ-
ten manager guidelines in place, which are adjusted as necessary
to ensure appropriate diversification levels. Also, annual audits of
the investment managers are conducted by independent auditors.
Finally, to minimize operational risk, the Company utilizes a master
custodian for all plan assets, and each investment manager rec-
onciles its account with the custodian at least quarterly.
Other Postretirement Benefits
The Company provides medical and dental benefits to retirees
based on age and years of service. Benefits under these plans are
paid through a voluntary employees beneficiary association trust;
however, this is not considered to be a prefunding arrangement
under SFAS No. 106. The Company provides a defined dollar com-
mitment toward retiree medical premiums. In 2001, the Company
amended these plans to freeze eligibility for retiree coverage and
to further reduce and limit the Company’s contributions toward pre-
miums. These changes were accounted for as a negative plan
amendment in accordance with SFAS No. 106. Accordingly, the
effects of reducing eligibility and Company contributions toward
retiree premiums are being amortized over the remaining years of
service to eligibility of the active plan participants. The decrease
in the other postretirement expense presented in the table below is
due to declining participant enrollments in the plan.
Medicare Reform Act
—
The Company’s accumulated post-retire-
ment benefit obligation (APBO) and net cost recognized for other
postretirement plans do not reflect the effects of the Medicare
Prescription Drug, Improvement, and Modernization Act of 2003
(Act) passed in December 2003. The provisions of the Act provide
for a federal subsidy for plans that provide prescription drug ben-
efits and meet certain qualifications. Specific authoritative guid-
ance on the accounting for the federal subsidy was issued in
January 2005, and its impact on the Company’s actuarially deter-
mined APBO and net cost for other postretirement benefit plans is
currently being evaluated. Due to the cap on Company contribu-
tions, the potential effects of the Act are not expected to have a
material effect on the Company’s consolidated financial state-
ments. There was no impact on 2003 or 2002 since the measure-
ment dates for the Company’s other postretirement benefit plans
were October 31, 2003 and 2002, respectively, which were prior to
the date the Act was passed.
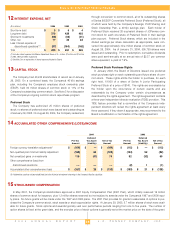
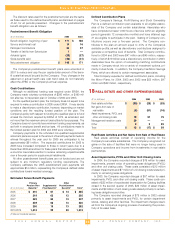
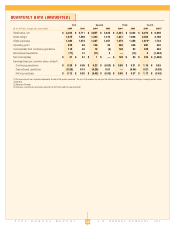
Postretirement (Income)/Expense
($ in millions)
2004 2003 2002
Service costs
$3$3$3
Interest costs
11 13 16
Net amortization
(22) (20) (16)
Net periodic postretirement
benefit (income)/expense
$ (8) $ (4) $ 3