JCPenney 2004 Annual Report Download - page 50
Download and view the complete annual report
Please find page 50 of the 2004 JCPenney annual report below. You can navigate through the pages in the report by either clicking on the pages listed below, or by using the keyword search tool below to find specific information within the annual report.-
 1
1 -
2
-
3
-
4
-
5
-
6
-
7
-
8
-
9
-
10
-
11
-
12
-
13
-
14
-
15
-
16
-
17
-
18
-
19
-
20
-
21
-
22
-
23
-
24
-
25
-
26
-
27
-
28
-
29
-
30
-
31
-
32
-
33
-
34
-
35
-
36
-
37
-
38
-
39
-
 40
40 -
 41
41 -
 42
42 -
 43
43 -
 44
44 -
 45
45 -
 46
46 -
 47
47 -
 48
48 -
 49
49 -
 50
50 -
 51
51 -
 52
52 -
 53
53 -
 54
54 -
 55
55 -
 56
56
 |
 |

J.C. PENNEY COMPANY, INC.2 004 ANNUAL REPORT
48
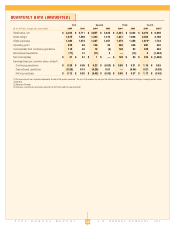
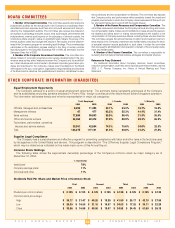
QUARTERLY DATA (UNAUDITED)
First Second Third Fourth
($ in millions, except per share data)
2004 2003 2004 2003 2004 2003 2004 2003(2)
Retail sales, net
$ 4,033 $ 3,711 $ 3,857 $ 3,645 $ 4,461 $ 4,332 $ 6,073 $ 6,098
Gross margin
1,615 1,456 1,443 1,310 1,821 1,666 2,260 2,188
SG&A expenses
1,386 1,372 1,287 1,257 1,475 1,458 1,679(3) 1,743
Operating profit
229 84 156 53 346 208 581 445
Income/(loss) from continuing operations
118 20 72 (3) 149 94 328 253
Discontinued operations
(77) 41 (71) 3 –– (14) 5 (1,322)
Net income/(loss)
$ 41 $ 61 $ 1 $ –– $ 149 $ 80 $ 333 $ (1,069)
Earnings/(loss) per common share, diluted(1):
Continuing operations
$ 0.38 $ 0.05 $ 0.23 $ (0.03) $ 0.50 $ 0.31 $ 1.16 $ 0.83
Discontinued operations
(0.25) 0.15 (0.25) 0.01 –– (0.04) 0.01 (4.25)
Net income/(loss)
$ 0.13 $ 0.20 $ (0.02) $ (0.02) $ 0.50 $ 0.27 $ 1.17 $ (3.42)
(1) Per share amounts are computed independently for each of the quarters presented. The sum of the quarters may not equal the total year amount due to the impact of changes in average quarterly shares
outstanding.
(2) Represents 14 weeks.
(3) Includes a cumulative pre-tax expense adjustment of $8 million related to lease accounting.