JCPenney 2004 Annual Report Download - page 13
Download and view the complete annual report
Please find page 13 of the 2004 JCPenney annual report below. You can navigate through the pages in the report by either clicking on the pages listed below, or by using the keyword search tool below to find specific information within the annual report.-
 1
1 -
2
-
 3
3 -
 4
4 -
 5
5 -
 6
6 -
 7
7 -
 8
8 -
 9
9 -
 10
10 -
 11
11 -
 12
12 -
 13
13 -
 14
14 -
 15
15 -
 16
16 -
 17
17 -
 18
18 -
 19
19 -
 20
20 -
 21
21 -
 22
22 -
 23
23 -
24
-
25
-
26
-
27
-
28
-
29
-
30
-
31
-
32
-
33
-
34
-
35
-
36
-
37
-
38
-
39
-
40
-
41
-
42
-
43
-
44
-
45
-
46
-
47
-
48
-
49
-
50
-
51
-
52
-
53
-
54
-
55
-
56
 |
 |

J.C. PENNEY COMPANY, INC.2 004 ANNUAL REPORT
Management’s Discussion and Analysis of Financial Condition and Results of Operations
11
on- and off-balance sheet obligations were retired during 2004 as
follows:
• JCP’s 7.375% Notes in the amount of $208 million matured and
were paid.
•JCP retired its 9.75% Debentures Due 2021. Of the total
balance of $117.2 million, $25 million was retired at par, and the
remaining $92.2 million was redeemed at a price of 103.2%
plus accrued interest.
•JCP retired the entire $195.7 million balance of its 8.25%
Debentures Due 2022. $37.5 million of the balance was retired
at par, with the remaining $158.2 million being redeemed at a
price of 103.096% plus accrued interest.
•JCP redeemed its $200 million face amount 6.0% Original
Issue Discount Debentures Due 2006. At the date of
redemption, these debentures had a recorded balance of $175
million, due to the unamortized discount of $25 million.
•The Company purchased approximately $100 million of JCP’s
7.6% Notes Due 2007 in the open market.
•The Company called all of JCP’s outstanding $650 million 5.0%
Convertible Subordinated Notes Due 2008. Holders of the
Notes had the option to convert the Notes into shares of the
Company’s common stock at a conversion price of $28.50.
All but $0.7 million of the Notes were converted into
approximately 22.8 million shares, and the remaining Notes
were redeemed at a price of 102.5% plus accrued interest.
•As reflected in Cash (Paid to)/Received from Discontinued
Operations on the Consolidated Statements of Cash Flows,
Eckerd’s managed care receivables securitization program
was paid off for a total of $221 million and the program was
terminated.
During 2003:
•The Company issued $600 million principal amount of
unsecured 8.0% Notes Due 2010 at an effective interest rate of
8.125%.
•The Company retired $442 million of long-term debt,
principally debt issues that matured during 2003.
During 2002:
•The Company completed a debt exchange in which certain
bondholders tendered approximately $227 million principal
amount of three existing debt issues in exchange for new 9.0%
Notes Due 2012 with a principal amount of approximately $230
million. Bondholders exchanged $79 million principal amount
of the Company’s 6.125% Notes Due 2003, $67 million
principal amount of its 7.375% Notes Due 2004 and $81 million
principal amount of its 6.9% Debentures Due 2026. This
transaction effectively extended the maturity on amounts
represented by the exchanged notes and strengthened the
Company’s liquidity.
• Approximately $920 million of long-term debt matured and was
paid.
Equity
—During 2004, the Company returned approximately
$2.1 billion to stockholders through common stock repurchases and
dividend payments. The Company repurchased 50.1 million shares
of common stock for approximately $2.0 billion, including approxi-
mately $51 million of cash paid after January 29, 2005 for settlement
of repurchases. Common stock is retired on the same day it is repur-
chased and the related cash settlements are completed on the third
business day following the repurchase. No common stock repur-
chases were made during 2003 or 2002.
JCPenney paid quarterly dividends on its common stock of
$0.125 per share in 2004, 2003 and 2002. The Company’s Board of
Directors reviews the dividend policy and rate on a quarterly basis,
taking into consideration the overall financial and strategic outlook
for the Company, earnings, liquidity and cash flow projections, as
well as competitive factors. The Company also paid semi-annual
dividends on its Series B ESOP Convertible Preferred Stock at an
annual rate of $2.37 per common share equivalent, until all out-
standing shares were converted to common shares on August 26,
2004.
Net proceeds from the exercise of stock options were approxi-
mately $248 million in 2004, compared to $31 million in 2003 and $9
million in 2002.
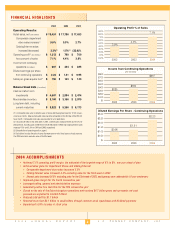
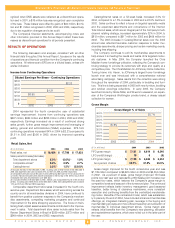
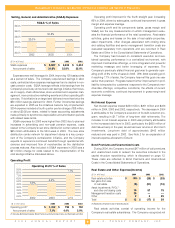
Free Cash Flow from Continuing Operations
($ in millions)
2004 2003 2002
Net cash provided by
operating activities (GAAP)
$1,127 $ 812 $ 522
Less:
Capital expenditures
(412) (373) (315)
Dividends paid
(150) (160) (161)
Plus:
Proceeds from sale of assets
34 100 38
Free cash flow from
continuing operations
$599 $ 379 $ 84
Free cash flow is an important financial measure, which is widely
focused upon by investors, the rating agencies and banks. Although it
is not a GAAP measure, it is derived from components of the
Company’s consolidated GAAP cash flow statement. Positive free
cash flow generated by a company indicates the amount of cash avail-
able for reinvestment in the business, or cash that can be returned to
investors through increased dividends, stock repurchase programs,
debt retirements, or a combination of these. Conversely, negative free
cash flow indicates the amount of cash that must be raised from
investors through new debt or equity issues, reduction in available cash
balances or a combination of these.
The Company generated $599 million of free cash flow in 2004,
which represented the fifth consecutive year of positive free cash flow.
The improvement from 2003 to 2004 was primarily the result of higher
income from continuing operations.
Cash Flow and Financing Outlook
The Company’s financial position strengthened significantly dur-
ing 2004 as a result of improved operating performance, positive
free cash flow, the sale of Eckerd and the capital structure reposi-
tioning program. As of year-end 2004, Cash and Short-Term
Investments were approximately $4.7 billion, of which, approxi-
mately $2.2 billion is planned to be used during 2005 to complete
the 2004 and 2005 capital structure repositioning programs.
In accordance with its financing strategy, the Company expects
to maintain a strong liquidity position. Until the Company’s credit
ratings improve to investment-grade levels, access to the capital
markets for cash needs will retain an element of uncertainty. As
such, management intends to maintain sufficient cash investment
levels to ensure support for strategic and operational business
needs, long-term debt maturities, dividends and contingency
items, such as the cash contributions made to the Company’s qual-
ified pension plan during the 2002-2004 period.
For 2005, free cash flow is expected to be approximately $100
million, reflecting an increase in capital expenditures to $700 mil-
lion in support of the Company’s investment in both new and exist-
ing stores, as well as new point-of-sale technology.
In accordance with its long-term financing strategy, the