JCPenney 2004 Annual Report Download - page 51
Download and view the complete annual report
Please find page 51 of the 2004 JCPenney annual report below. You can navigate through the pages in the report by either clicking on the pages listed below, or by using the keyword search tool below to find specific information within the annual report.-
 1
1 -
2
-
3
-
4
-
5
-
6
-
7
-
8
-
9
-
10
-
11
-
12
-
13
-
14
-
15
-
16
-
17
-
18
-
19
-
20
-
21
-
22
-
23
-
24
-
25
-
26
-
27
-
28
-
29
-
30
-
31
-
32
-
33
-
34
-
35
-
36
-
37
-
38
-
39
-
40
-
 41
41 -
 42
42 -
 43
43 -
 44
44 -
 45
45 -
 46
46 -
 47
47 -
 48
48 -
 49
49 -
 50
50 -
 51
51 -
 52
52 -
 53
53 -
 54
54 -
 55
55 -
 56
56
 |
 |

J.C. PENNEY COMPANY, INC.2 004 ANNUAL REPORT
49
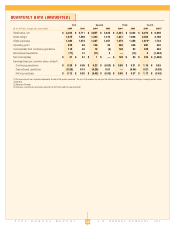
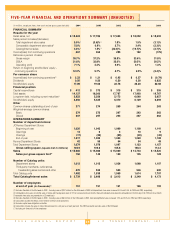
FIVE-YEAR FINANCIAL AND OPERATIONS SUMMARY (UNAUDITED)
(in millions, except per share, store count and per gross square foot data)
2004 2003 2002 2001 2000
FINANCIAL SUMMARY
Results for the year
Retail sales, net
$ 18,424 $ 17,786 $ 17,633 $ 18,092 $ 18,693
Sales percent increase/(decrease)
Total department store sales
5.0%
(1)
(0.6)%
(1)
1.9% 1.5% (3.1)%
Comparable department store sales(2)
5.0% 0.9% 2.7% 3.4% (2.3)%
Catalog/Internet sales
3.3%
(3)
1.5%
(3)
(22.0)% (19.7)% (2.7)%
Income/(loss) from continuing operations
667 364 285 182 (175)
Ratios as a percent of sales:
Gross margin
38.7% 37.2% 35.9% 33.6% 31.8%
SG&A
31.6% 32.8% 32.0% 30.5% 30.5%
Operating profit
7.1% 4.4% 3.9% 3.1% 1.3%
Return on beginning stockholders’ equity –
continuing operations
12.3% 5.7% 4.7% 2.9% (2.4)%
Per common share
Income/(loss) from continuing operations(4)
$ 2.23 $ 1.21 $ 0.95 $ 0.57 $ (0.79)
Dividends
0.50 0.50 0.50 0.50 0.825
Stockholders’ equity
17.89 19.08 22.78 22.20 22.68
Financial position
Capital expenditures
$ 412 $ 373 $ 315 $ 315 $ 355
Total assets
14,127 18,300 17,787 17,993 19,767
Long-term debt, including current maturities(5)
3,923 5,356 5,173 6,060 5,657
Stockholders’ equity
4,856 5,425 6,370 6,129 6,259
Other
Common shares outstanding at end of year
271 274 269 264 263
Weighted-average common shares:
Basic
279 272 267 263 262
Diluted
307 297 293 267 262
OPERATIONS SUMMARY
Number of department stores:
JCPenney Department Stores
Beginning of year
1,020 1,043 1,069 1,108 1,141
Openings
14 6 3 10 9
Closings
(17) (29) (29) (49) (42)
End of year
1,017 1,020 1,043 1,069 1,108
Renner Department Stores
62 58 54 54 49
Total Department Stores
1,079 1,078 1,097 1,123 1,157
Gross selling space
(square feet in millions)
103.9 103.6 105.6 108.3 112.3
Sales
$ 15,685 $ 15,088 $ 15,020 $ 14,743 $ 14,520
Sales per gross square foot(6)
150 143 140 135 128
Number of Catalog units:
Department stores
1,012 1,015 1,036 1,068 1,107
Third-party merchants, outlet stores,
freestanding sales centers and other
470 524 523 546 600
Total Catalog units
1,482 1,539 1,559 1,614 1,707
Total Catalog/Internet sales
$ 2,739 $ 2,698 $ 2,613 $ 3,349 $ 4,173
Number of employees
at end of year
(in thousands)
(7)
151 151 161 166 193
(1) Excludes the effect of the 53rd week in 2003. Including sales of $152 million for the 53rd week in 2003, total department store sales increased 4.0% and 0.5% for 2004 and 2003, respectively.
(2) Comparable store sales include the sales of stores after having been open for 12 full consecutive fiscal months. New and relocated stores become comparable on the first day of the 13th full fiscal month.
Comparable store sales are presented on a 52-week basis.
(3) Excludes the effect of the 53rd week in 2003. Including sales of $46 million for the 53rd week in 2003, total Catalog/Internet sales increased 1.5% and 3.3% for 2004 and 2003, respectively.
(4) Calculation excludes the effects of anti-dilutive common stock equivalents.
(5) Includes capital lease obligations and other.
(6) Calculation includes the sales of stores that were open for a full year as of each year end. The 2003 calculation excludes sales of the 53rd week.
(7) Includes part-time and full-time employees.