JCPenney 2004 Annual Report Download - page 44
Download and view the complete annual report
Please find page 44 of the 2004 JCPenney annual report below. You can navigate through the pages in the report by either clicking on the pages listed below, or by using the keyword search tool below to find specific information within the annual report.-
 1
1 -
2
-
3
-
4
-
5
-
6
-
7
-
8
-
9
-
10
-
11
-
12
-
13
-
14
-
15
-
16
-
17
-
18
-
19
-
20
-
21
-
22
-
23
-
24
-
25
-
26
-
27
-
28
-
29
-
30
-
31
-
32
-
33
-
 34
34 -
 35
35 -
 36
36 -
 37
37 -
 38
38 -
 39
39 -
 40
40 -
 41
41 -
 42
42 -
 43
43 -
 44
44 -
 45
45 -
 46
46 -
 47
47 -
 48
48 -
 49
49 -
 50
50 -
 51
51 -
 52
52 -
 53
53 -
 54
54 -
55
-
56
 |
 |

J.C. PENNEY COMPANY, INC.2 004 ANNUAL REPORT
Notes to the Consolidated Financial Statements
42
The discount rate used to measure pension expense each year
is the rate as of the beginning of the year (i.e., the prior measure-
ment date). The discount rate is based on a portfolio of high-qual-
ity corporate bonds with similar average cash flow durations to the
pension liability. The rate as of the end of 2004, which will be used
to measure 2005 pension expense, was reduced to 5.85%. The
expected return on plan assets is based on the plan’s long-term
asset allocation policy, historical returns for plan assets and overall
capital market returns, taking into account current and expected
market conditions. Given lower asset returns over the 2000-2002
period and lower expected future returns, the Company lowered
the expected rate of return on plan assets from 9.5% to 8.9% as of
October 31, 2002, which was used to develop the pension
expense for 2003 and 2004. The combination of assumption
changes and poor investment returns in 2002 and 2001 resulted in
an increase in 2003 pension expense of $106 million. Subsequent
improvements in investment returns in 2003 combined with the
Company’s contribution of $300 million pre-tax led to a decrease in
pension expense of $48 million in 2004.
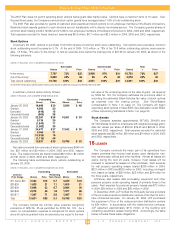
Funded Status
—
The table below provides a reconciliation of
benefit obligations, plan assets and the funded status of the
defined benefit pension and supplemental retirement plans. The
projected benefit obligation (PBO) is the present value of benefits
earned to date by plan participants, including the effect of
assumed future salary increases. Assets used in calculating the
funded status are measured at fair value at October 31 (the plan’s
measurement date).
Assets and Obligations
Pension Plans Supplemental Plans
($ in millions)
2004 2003 2004 2003
Change in PBO
Beginning of year
$ 3,302 $ 2,839 $ 405 $ 339
Service and
interest costs
290 270 25 26
Actuarial loss
344 379 53 67
Benefits (paid)(1)
(205) (186) (28) (27)
End of year
$ 3,731 $ 3,302 $ 455 $ 405
Change in fair
value of plan
assets
Beginning of year
$ 3,523 $ 2,886 $ — $ —
Company
contributions
300 300 28 27
Actual return
on assets
383 523 — —
Benefits (paid)(1)
(205) (186) (28) (27)
End of year
$ 4,001 $ 3,523 $ — $ —
Funded status
of plan
Excess of fair value
over projected
benefits
$ 270 $ 221 $ (455) $ (405)
Unrecognized
losses and prior
service cost
1,268 1,099 261(2) 177(2)
Prepaid pension
cost/(accrued
liability)
$ 1,538 $ 1,320 $ (194) $ (228)
(1) Does not include plan administrative expenses.
(2) Includes fourth quarter Company contributions of approximately $56 million and $9 million in 2004
and 2003, respectively.
In the reconciliation of the fair value of plan assets, the actual
return on net assets of $383 million in 2004, which is net of plan
administrative expenses, was due to continued improvement in
capital market returns in 2004 following the market rebound in
2003. The actual one-year return on pension plan assets at the
October 31 measurement date in 2004 and 2003 was 11.7% and
19.5%, respectively.
The unrecognized losses, including prior service cost, of $1,268
million will be amortized, subject to a corridor as permitted under
SFAS No. 87, as pension expense over the average remaining
service period of the covered workforce. Such amortization,
included in total pension expense, will reduce the prepaid pension
cost.
A
ssumptions to Determine Obligations
—
The weighted-aver-
age actuarial assumptions used to determine benefit obligations at
the October 31 measurement dates were as follows:
2004 2003 2002
Discount rate
5.85% 6.35% 7.10%
Salary progression rate
4.0% 4.0% 4.0%
For purposes of estimating demographic mortality in the measure-
ment of the Company’s pension obligation, as of October 31, 2004,
the Company began using the Retirement Plans 2000 Table of
Combined Healthy Lives, projected to 2005, using Scale AA to
forecast mortality improvements five years into the future to 2005.
Previously, the Company had utilized the 1983 Group Annuity
Mortality Table, which it continues to use for calculating funding
requirements based on Internal Revenue Service regulations.
Accumulated Benefit Obligation (ABO)
—
The ABO is the pres-
ent value of benefits earned to date, assuming no future salary
growth. The ABO for the Company’s primary pension plan was
$3.4 billion and $3.0 billion as of October 31, 2004 and 2003,
respectively. Plan assets of $4.0 billion for the primary pension
plan exceeded the ABO by approximately $0.6 billion, due to total
cash contributions of $600 million made to the plan during 2004
and 2003, combined with strong asset returns in 2004 and 2003.
The ABO for the Company’s unfunded supplemental pension plans
was $419 million and $372 million as of October 31, 2004 and
2003, respectively. The unfunded ABO for the supplemental plans
exceeded the recorded liability at year-end 2004 by $169 million,
which required an additional minimum liability adjustment. See fur-
ther discussion below.
Additional Minimum Liability
—
At the measurement date of
October 31, the fair value of pension plan assets in the primary
pension plan exceeded both the PBO and the ABO. Therefore, the
Company was not required to reflect a minimum liability adjustment
under SFAS No. 87, which would have removed the prepaid pen-
sion cost (asset) of $1.5 billion with the offset of approximately $0.9
billion, net of taxes, charged against stockholders’ equity. Prepaid
Pension on the Company’s Consolidated Balance Sheet as of year-
end 2004 represents pension funding in excess of pension
expense recognized through the Consolidated Statement of
Operations. The prepaid pension cost has accumulated from the
inception of the pension plan in 1966, principally as a result of the
Company’s policy to target a funded ratio in the range of 110% to
130%.
As a result of the weakness in the global equity markets over the
2000-2002 timeframe, the pension surplus of the defined benefit
pension plan declined from approximately $1.2 billion in 2000 to a
surplus of $45 million at the measurement date in 2002. With the