JCPenney 2004 Annual Report Download - page 10
Download and view the complete annual report
Please find page 10 of the 2004 JCPenney annual report below. You can navigate through the pages in the report by either clicking on the pages listed below, or by using the keyword search tool below to find specific information within the annual report.-
 1
1 -
 2
2 -
 3
3 -
 4
4 -
 5
5 -
 6
6 -
 7
7 -
 8
8 -
 9
9 -
 10
10 -
 11
11 -
 12
12 -
 13
13 -
 14
14 -
 15
15 -
 16
16 -
 17
17 -
 18
18 -
 19
19 -
 20
20 -
 21
21 -
22
-
23
-
24
-
25
-
26
-
27
-
28
-
29
-
30
-
31
-
32
-
33
-
34
-
35
-
36
-
37
-
38
-
39
-
40
-
41
-
42
-
43
-
44
-
45
-
46
-
47
-
48
-
49
-
50
-
51
-
52
-
53
-
54
-
55
-
56
 |
 |
J.C. PENNEY COMPANY, INC.2 004 ANNUAL REPORT
Management’s Discussion and Analysis of Financial Condition and Results of Operations
8
ognized when DMS assets were reflected as a discontinued opera-
tion and in 2001, a $16 million loss was recognized upon completion
of the sale. These losses were offset by gains of $34 million, $4 mil-
lion and $1 million recognized in 2002, 2003 and 2004, respectively,
due to tax regulation changes and a tax audit.
The Company’s financial statements, accompanying notes and
other information provided in this Annual Report reflect these busi-
nesses as discontinued operations for all periods presented.
RESULTS OF OPERATIONS
The following discussion and analysis, consistent with all other
financial data throughout this Annual Report, focuses on the results
of operations and financial condition from the Company’s continuing
operations. All references to EPS are on a diluted basis, unless oth-
erwise indicated.
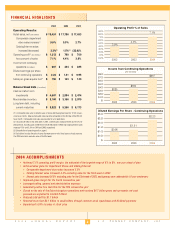
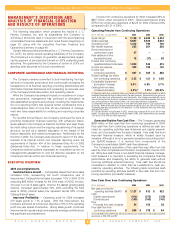
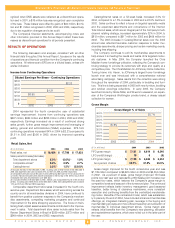
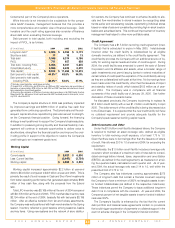
Income from Continuing Operations
2004 represented the fourth consecutive year of substantial
earnings improvement. Income from continuing operations was
$667 million, $364 million and $285 million in 2004, 2003 and 2002,
respectively. Earnings increased as a result of continued strong
sales growth, further gross margin improvement and leveraging of
selling, general and administrative (SG&A) expenses. EPS from
continuing operations increased 84% in 2004 to $2.23 compared to
$1.21 in 2003 and $0.95 in 2002, driven by improved operating
profit.
Retail Sales, Net
($ in millions)
2004 2003 2002
Retail sales, net
$ 18,424 $ 17,786 $ 17,633
Sales percent increase/(decrease):
Total department stores
5.0%
(1)
(
0.6%)
(1)
1.9%
Comparable stores(2)
5.0% 0.9% 2.7%
Catalog/Internet
3.3%
(3)
1.5%
(3)
(22.0)%
(1) Excludes the effect of the 53rd week in 2003. Including sales of $152 million for the 53rd week in
2003, total department store sales increased 4.0% and 0.5% for 2004 and 2003, respectively.
(2) Comparable store sales include the sales of stores after having been open for 12 full consecutive fis-
cal months. New and relocated stores become comparable on the first day of the 13th full fiscal month.
Comparable store sales are presented on a 52-week basis.
(3) Excludes the effect of the 53rd week in 2003. Internet sales increased 34.0% and 47.8% for those
periods. Including sales of $46 million for the 53rd week in 2003, total Catalog/Internet sales increased
1.5% and 3.3% for 2004 and 2003, respectively.
Comparable department store sales increased for the fourth con-
secutive year. Department Store sales, which were strong across the
country and in all merchandise divisions in 2004, have continued to
benefit from positive customer response to the Company’s merchan-
dise assortments, compelling marketing programs and continued
improvement in the store shopping experience. The focus on main-
taining fresh, stylish seasonal assortments contributed to the improve-
ment in sales. Total department store sales include sales from the
Renner Department Stores in Brazil of $329 million, $273 million and
$249 million in 2004, 2003 and 2002, respectively.
Catalog/Internet sales on a 52-week basis increased 3.3% for
2004, compared to a 1.5% increase in 2003 and a 22.0% decline in
2002. Sales continue to reflect a focus on targeted specialty media
and the expanded assortments and convenience of the Internet.
Total Internet sales, which are an integral part of the Company’s multi-
channel retailing strategy, increased approximately 32% in 2004, to
$812 million, compared to $617 million for 2003 and $409 million for
2002. The 2003 increase in Catalog/Internet sales over the 2002
amount also reflected favorable customer response to better mer-
chandise assortments, sharper pricing and certain marketing events,
including free shipping.
The Company continues to edit its merchandise assortments to
help ensure it is meeting the needs and wants of its targeted moder-
ate customer. In May 2004, the Company launched the Chris
Madden home furnishings collection, reflecting the Company’s con-
tinuing strategy to provide its customers with style and quality at a
competitive price. The Chris Madden for JCPenney Home Collection,
Turning Home into Haven, is JCPenney’s largest home furnishings
launch ever and was introduced with a comprehensive national
advertising campaign. Sales results from the collection were strong
throughout the remainder of 2004, particularly in bedding and furni-
ture. This line is being expanded in 2005 with new furniture, bedding
and window coverings collections. In early 2005, the Company
launched nicole by Nicole Miller, and W-work to weekend, an expan-
sion of the Company’s Worthington private brand, a dressy casual
collection for women.
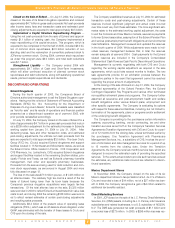
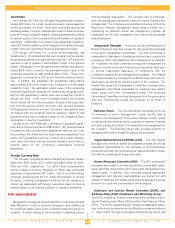
Gross Margin
($ in millions)
2004 2003 2002
FIFO gross margin
$ 7,121 $ 6,614 $ 6,340
LIFO credit/(charge)
18 6 (6)
LIFO gross margin
$ 7,139 $ 6,620 $ 6,334
As a percent of sales
38.7% 37.2% 35.9%
Gross margin improved for the fourth consecutive year and was
$7,139 million compared to $6,620 million in 2003 and $6,334 million
in 2002. As a percent of sales, gross margin improved 150 basis
points over last year and represents a 690 basis-point increase over
the past four years, which restores the Company’s gross margin to
competitive levels and was part of the turnaround plan. The continued
improvement reflects better inventory management, good seasonal
transition, better timing of clearance markdowns, more consistent
execution and continuing benefits from the centralized merchandis-
ing model. Benefits of the centralized model, which was substantial-
ly in place by the end of 2004, have included enhanced merchandise
offerings, an integrated marketing plan, leverage in the buying and
merchandising process and more efficient selection and allocation of
merchandise to individual department stores. Gross margin also
reflects initial benefits from the Company’s new planning, allocation
and replenishment systems, which were rolled out in the latter part of
the year.
$3.00
$2.50
$2.00
$1.50
$1.00
$0.50
$-
$0.95
$1.21
$2.23
2002 2003 2004
Diluted Earnings Per Share - Continuing Operations
Gross Margin % of Sales
40.0%
39.0%
38.0%
37.0%
36.0%
35.0%
34.0%
33.0%
32.0%
35.9%
37.2%
38.7%
2002 2003 2004