JCPenney 2004 Annual Report Download - page 11
Download and view the complete annual report
Please find page 11 of the 2004 JCPenney annual report below. You can navigate through the pages in the report by either clicking on the pages listed below, or by using the keyword search tool below to find specific information within the annual report.-
 1
1 -
 2
2 -
 3
3 -
 4
4 -
 5
5 -
 6
6 -
 7
7 -
 8
8 -
 9
9 -
 10
10 -
 11
11 -
 12
12 -
 13
13 -
 14
14 -
 15
15 -
 16
16 -
 17
17 -
 18
18 -
 19
19 -
 20
20 -
 21
21 -
 22
22 -
23
-
24
-
25
-
26
-
27
-
28
-
29
-
30
-
31
-
32
-
33
-
34
-
35
-
36
-
37
-
38
-
39
-
40
-
41
-
42
-
43
-
44
-
45
-
46
-
47
-
48
-
49
-
50
-
51
-
52
-
53
-
54
-
55
-
56
 |
 |

J.C. PENNEY COMPANY, INC.2 004 ANNUAL REPORT
Management’s Discussion and Analysis of Financial Condition and Results of Operations
9
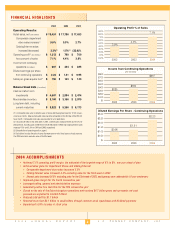
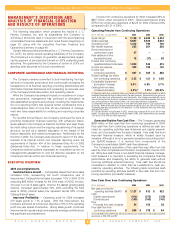
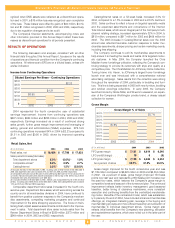
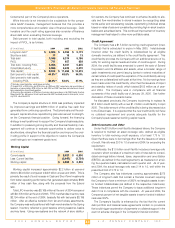
Selling, General and Administrative (SG&A) Expenses
($ in millions)
2004 2003 2002
SG&A expenses
$ 5,827 $ 5,830 $ 5,634
As a percent of sales
31.6% 32.8% 32.0%
Expenses were well leveraged in 2004, improving 120 basis points
as a percent of sales. The Company experienced savings in labor
costs, centralized store expense management and a decline in non-
cash pension costs. SG&A leverage reflects initial savings from the
Company’s previously announced cost savings initiative that focus-
es on supply chain efficiencies, store workload and expense man-
agement, more productive marketing events and other operating effi-
ciencies. This initiative is on target and delivered more than twice the
$50 million savings planned for 2004. Further incremental savings
are expected in 2005 as the initiatives become fully implemented.
2004 expense included a fourth quarter pre-tax charge of $8 million,
or about $0.02 per share, related to lease accounting adjustments
made primarily to synchronize depreciation and amortization periods
with related lease terms.
SG&A expenses for 2003 were higher than 2002 due to planned
increases in advertising and non-cash pension expense, costs
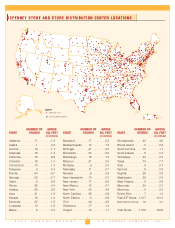
related to the Company’s new store distribution center network and
$65 million attributable to the 53rd week in 2003. The new store
distribution center network for department stores is a key compo-
nent of the Company’s centralization initiative, and the Company
expects to experience continued benefits through operational effi-
ciencies and improved flow of merchandise as the distribution
process matures. Also included in SG&A expenses in 2003 was a
$21 million charge for costs related to the implementation of the
cost savings initiative discussed above.
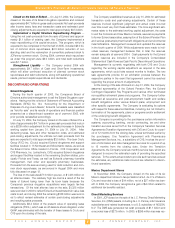
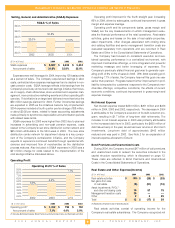
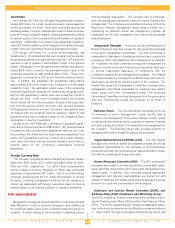
Operating Profit
($ in millions)
2004 2003 2002
Operating profit(1)
$ 1,312 $ 790 $ 700
As a percent of sales
7.1% 4.4% 3.9%
(1) Excludes Net Interest Expense, Bond Premiums and Unamortized Costs, and Real Estate and Other.
Operating profit improved for the fourth straight year, increasing
66% in 2004, driven by sales gains, continued improvement in gross
margin and expense leverage.
Operating profit and its components (sales, gross margin and
SG&A) are the key measurements on which management evalu-
ates the financial performance of the retail operations. Real estate
activities, gains and losses on the sale of real estate properties,
asset impairments, other charges associated with closing store
and catalog facilities and senior management transition costs are
evaluated separately from operations and are recorded in Real
Estate and Other in the Consolidated Statements of Operations.
The Company has focused on consistent execution and sus-
tained operating performance in a centralized environment, with
improved merchandise offerings, a more integrated and powerful
marketing message and better leveraging of expenses. The
Company’s previously stated financial goal was to generate oper-
ating profit of 6% to 8% of sales in 2005. With 2004 operating prof-
it reaching 7.1% of sales, the Company has met this goal one year
earlier than planned. Progress toward further improvement in prof-
itability is impacted by customers’ response to the Company’s mer-
chandise offerings, competitive conditions, the effects of current
economic conditions, continued improvement in gross margin and
expense leverage.
Net Interest Expense
Net interest expense totaled $233 million, $261 million and $226
million in 2004, 2003 and 2002, respectively. The decrease in 2004
is attributable to the Company’s execution of its debt reduction pro-
gram, resulting in $1.7 billion of long-term debt retirements. The
increase in net interest expense in 2003 was primarily attributable
to the increased debt level in 2003, particularly the $600 million of
debt issued early in the year, as well as lower returns on short-term
investments. Long-term debt of approximately $442 million
matured and was paid in 2003. See Note 2 for an explanation of
interest expense allocated to Eckerd.
Bond Premiums and Unamortized Costs
During 2004, the Company incurred $47 million of call premiums
and unamortized costs to redeem the securities included in the
capital structure repositioning, which is discussed on page 12.
These costs are reflected in Bond Premiums and Unamortized
Costs in the Consolidated Statements of Operations.
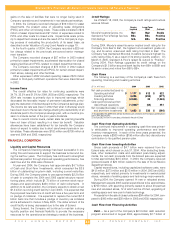
Real Estate and Other Expense/(Income)
($ in millions)
2004 2003 2002
Real estate activities
$ (30) $ (28) $ (25)
Net gains from sale
of real estate
(8) (51) (16)
Asset impairments, PVOL
(1)
and other unit closing costs
19 57 75
Management transition costs
29 — ––
Other
2 5 25
Total
$ 12 $ (17) $ 59
(1) Represents the present value of operating leases.
Real estate activities consist of operating income for the
Company’s real estate subsidiaries. The Company recognized net
Operating Profit % of Sales
9.0%
8.0%
7.0%
6.0%
5.0%
4.0%
3.0%
2.0%
1.0%
0.0%
3.9%
4.4%
7.1%
2002 2003 2004
SG&A % of Sales
35.0%
34.0%
33.0%
32.0%
31.0%
30.0%
32.0%
32.8%
31.6%
2002 2003 2004