JCPenney 2004 Annual Report Download - page 4
Download and view the complete annual report
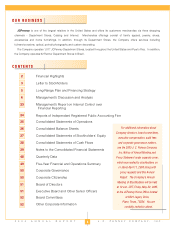
Please find page 4 of the 2004 JCPenney annual report below. You can navigate through the pages in the report by either clicking on the pages listed below, or by using the keyword search tool below to find specific information within the annual report.-
 1
1 -
 2
2 -
 3
3 -
 4
4 -
 5
5 -
 6
6 -
 7
7 -
 8
8 -
 9
9 -
 10
10 -
 11
11 -
 12
12 -
 13
13 -
 14
14 -
 15
15 -
16
-
17
-
18
-
19
-
20
-
21
-
22
-
23
-
24
-
25
-
26
-
27
-
28
-
29
-
30
-
31
-
32
-
33
-
34
-
35
-
36
-
37
-
38
-
39
-
40
-
41
-
42
-
43
-
44
-
45
-
46
-
47
-
48
-
49
-
50
-
51
-
52
-
53
-
54
-
55
-
56
 |
 |
J.C. PENNEY COMPANY, INC.2 004 ANNUAL REPORT
2
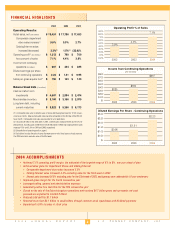
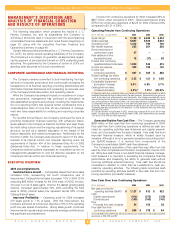
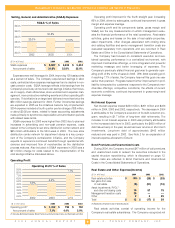
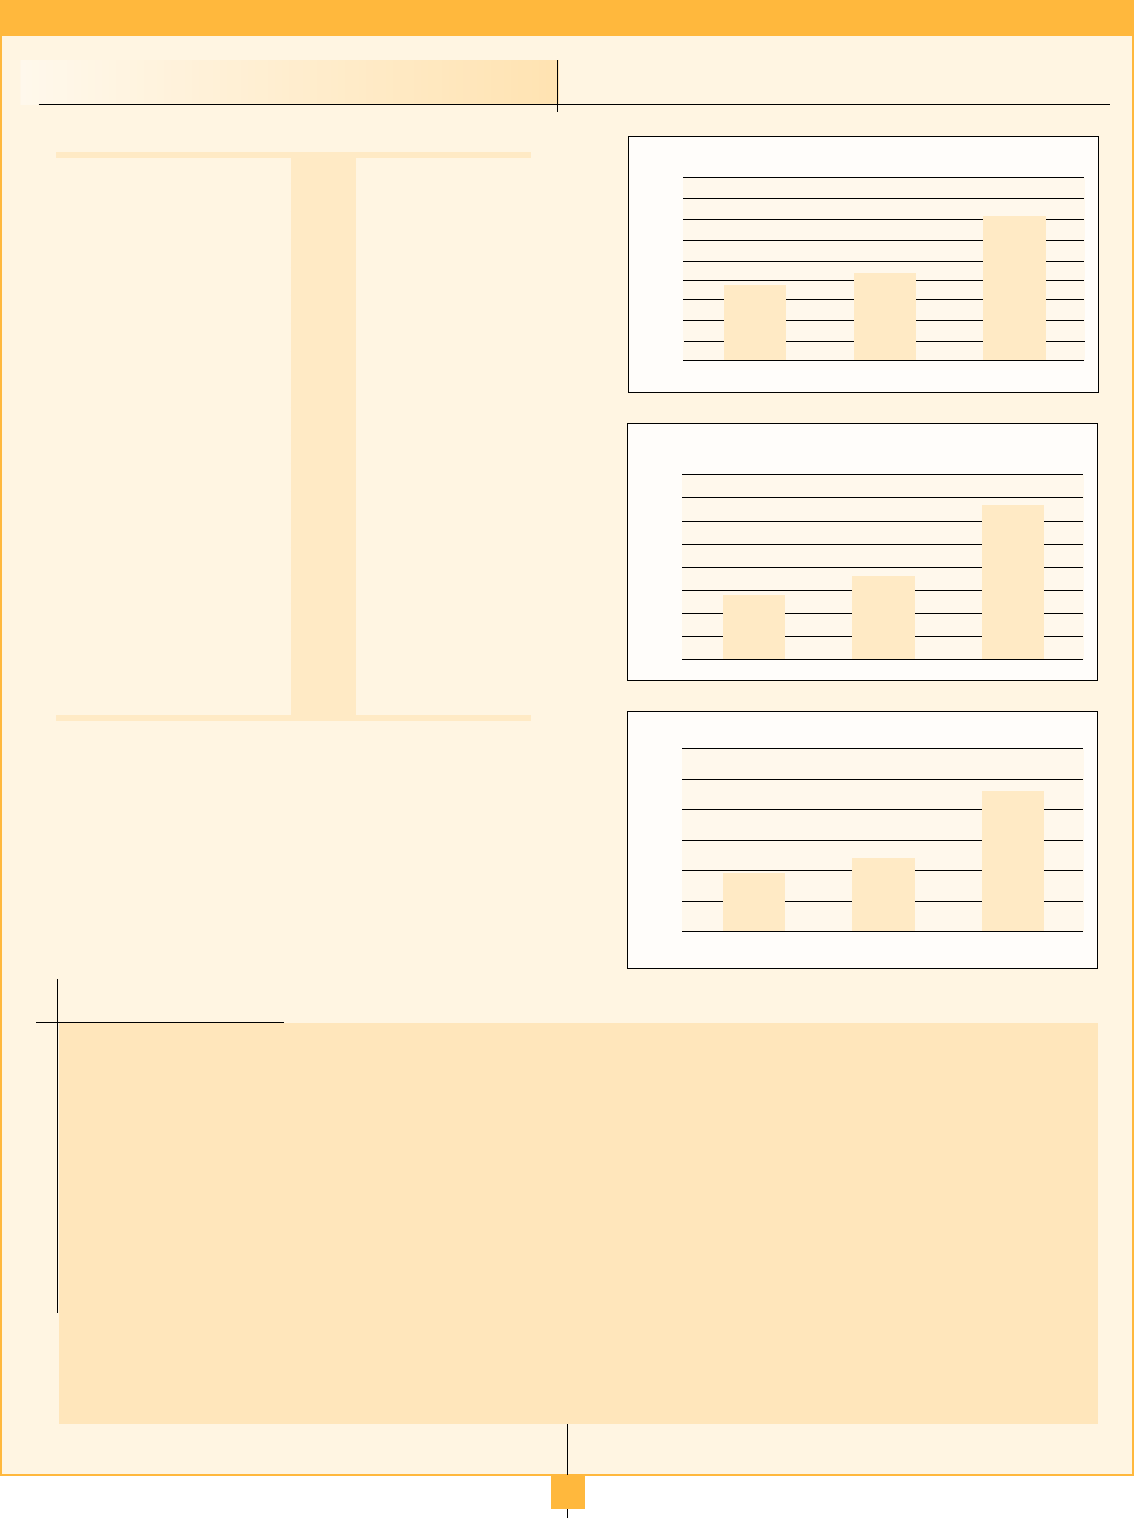
Income from Continuing Operations
($ in millions)
$800
$700
$600
$500
$400
$300
$200
$100
$-
$285
$364
$667
2002 2003 2004
$3.00
$2.50
$2.00
$1.50
$1.00
$0.50
$-
$0.95
$1.21
$2.23
2002 2003 2004
Diluted Earnings Per Share - Continuing Operations
2004 ACCOMPLISHMENTS
•Achieved 7.1% operating profit margin, the mid-point of the targeted range of 6% to 8%, one year ahead of plan
• Achieved sales gains for Department Stores and Catalog/Internet:
+ Comparable department store sales increased 5.0%
+ Catalog/Internet sales increased 3.3% excluding sales for the 53rd week in 2003
+Internet sales increased 34.0% excluding sales for the 53rd week of 2003 and jcpenney.com celebrated its 10-year anniversary
•Improved gross margin for the fourth consecutive year
• Leveraged selling, general and administrative expenses
• Generated positive free cash flow for the fifth consecutive year
• Closed on the sale of the Eckerd drugstore operations and received $4.7 billion gross cash proceeds; net cash
proceeds are expected to total $3.5 billion
• Reduced total debt by $1.7 billion
• Returned more than $2.1 billion to stockholders through common stock repurchases and dividend payments
• Experienced a 59% increase in stock price
FINANCIAL HIGHLIGHTS
2004 2003 2002
Operating Results:
Retail sales, net
($ in millions)
$ 18,424 $ 17,786 $ 17,633
Comparable department
store sales increase(1)
5.0% 0.9% 2.7%
Catalog/Internet sales
increase/(decrease)
3.3%(2) 1.5%(2) (22.0)%
Operating profit(3)
($ in millions)
$ 1,312 $ 790 $ 700
As a percent of sales
7.1% 4.4% 3.9%
Income from continuing
operations
($ in millions)
$667 $ 364 $ 285
Diluted earnings per share
from continuing operations
$2.23 $ 1.21 $ 0.95
Sales per gross square foot(4)
$ 150 $ 143 $ 140
Balance Sheet Data
($ in millions):
Cash and short-term
investments
$ 4,687 $ 2,994 $ 2,474
Merchandise inventory
$ 3,169 $ 3,156 $ 2,970
Long-term debt, including
current maturities
$ 3,923 $ 5,356 $ 5,173
(1) Comparable store sales include the sales of stores after having been open for 12 full consec-
utive fiscal months. New and relocated stores become comparable on the first day of the 13th full
fiscal month. Comparable store sales are presented on a 52-week basis.
(2) Excludes the effect of the 53rd week in 2003. Internet sales increased 34.0% and 47.8% for
those periods. Including sales of $46 million for the 53rd week in 2003, total Catalog/Internet sales
increased 1.5% and 3.3% for 2004 and 2003, respectively.
(3) See definition of operating profit on page 6.
(4) Calculation includes the sales of stores that were open for a full fiscal year as of each year end.
The 2003 calculation excludes sales of the 53rd week.
Operating Profit % of Sales
9.0%
8.0%
7.0%
6.0%
5.0%
4.0%
3.0%
2.0%
1.0%
0.0%
3.9%
4.4%
7.1%
2002 2003 2004