JCPenney 2004 Annual Report Download - page 33
Download and view the complete annual report
Please find page 33 of the 2004 JCPenney annual report below. You can navigate through the pages in the report by either clicking on the pages listed below, or by using the keyword search tool below to find specific information within the annual report.-
 1
1 -
2
-
3
-
4
-
5
-
6
-
7
-
8
-
9
-
10
-
11
-
12
-
13
-
14
-
15
-
16
-
17
-
18
-
19
-
20
-
21
-
22
-
 23
23 -
 24
24 -
 25
25 -
 26
26 -
 27
27 -
 28
28 -
 29
29 -
 30
30 -
 31
31 -
 32
32 -
 33
33 -
 34
34 -
 35
35 -
 36
36 -
 37
37 -
 38
38 -
 39
39 -
 40
40 -
 41
41 -
 42
42 -
 43
43 -
44
-
45
-
46
-
47
-
48
-
49
-
50
-
51
-
52
-
53
-
54
-
55
-
56
 |
 |

J.C. PENNEY COMPANY, INC.2 004 ANNUAL REPORT
Notes to the Consolidated Financial Statements
31
urement of the Company’s pension obligation, as of October 31,
2004, the Company began using the Retirement Plans 2000 Table of
Combined Healthy Lives, projected to 2005, using Scale AA to fore-
cast mortality improvements five years into the future to 2005.
Previously, the Company had utilized the 1983 Group Annuity
Mortality Table, which it continues to use for calculating funding
requirements based on Internal Revenue Service regulations.
Income Taxes
Income taxes are accounted for under the asset and liability
method prescribed by SFAS No. 109, “Accounting for Income
Taxes.” Deferred tax assets and liabilities are recognized for the
future tax consequences attributable to differences between the
financial statement carrying amounts of existing assets and liabili-
ties and their respective tax bases and operating loss and tax cred-
it carryforwards. Deferred tax assets and liabilities are measured
using enacted tax rates expected to apply to taxable income in the
years in which those temporary differences are expected to be
recovered or settled. The effect on deferred tax assets and liabili-
ties of a change in tax rates is recognized in income in the period
that includes the enactment date. A valuation allowance is record-
ed to reduce the carrying amounts of deferred tax assets unless it
is more likely than not that such assets will be realized.
Earnings/(Loss) per Share
Basic earnings/(loss) per share (EPS) is computed by dividing net
income/(loss) less dividend requirements on the Series B ESOP
Convertible Preferred Stock, net of tax as applicable, by the weight-
ed-average number of common shares outstanding for the period.
Except when the effect would be anti-dilutive at the continuing oper-
ations level, the diluted EPS calculation includes the impact of restrict-
ed stock units and shares that, during the period, could have been
issued under outstanding stock options, as well as common shares
that would have resulted from the conversion of convertible deben-
tures and convertible preferred stock. If the applicable shares are
included in the calculation, the related interest on convertible deben-
tures (net of tax) and preferred stock dividends (net of tax) are added
back to income, since these would not be paid if the debentures or
preferred stock were converted to common stock. Both the convert-
ible debentures and preferred stock were converted to common
stock in the second half of 2004. See Note 3.
Stock-Based Compensation
The Company has a stock-based compensation plan, which is
discussed more fully in Note 15. The Company accounts for the
plan under the recognition and measurement principles of
Accounting Principles Board Opinion No. 25, “Accounting for Stock
Issued to Employees” (APB No. 25), and related interpretations.
No stock-based employee compensation cost is reflected in the
accompanying Consolidated Statements of Operations for stock
options, since all options granted under the plan have an exercise
price equal to the market value of the underlying common stock on
the date of grant. Compensation expense for restricted stock
awards with pro-rata vesting is recorded on a straight-line basis
over the vesting period, which typically ranges from one to five
years.
The following table illustrates the effect on net income/(loss) and
EPS as if the Company had applied the fair value recognition pro-
visions of SFAS No. 123, “Accounting for Stock-Based
Compensation,” to stock options. Pro-forma expense for stock
options with pro-rata vesting is reflected on a straight-line basis
over the vesting period, which typically ranges from one to five
years.
($ in millions, except EPS)
2004 2003 2002
Net income/(loss), as
reported
$ 524 $ (928) $ 405
Add: Stock-based employee
compensation expense
included in reported net
income/(loss), net of related tax
effects
1353
Deduct: Total stock-based
employee compensation
expense determined under
fair value method for all
awards, net of related
tax effects
(24) (26) (23)
Pro-forma net income/(loss)
$ 513 $ (949) $ 385
Earnings/(loss) per share:
Basic—as reported
$ 1.83 $ (3.50) $ 1.41
Basic—pro forma
$ 1.80 $ (3.58) $ 1.34
Diluted—as reported
$ 1.76 $ (3.13) $ 1.36
Diluted—pro forma
$ 1.73 $ (3.20) $ 1.30
The Company used the Black-Scholes option-pricing model to
estimate the grant date fair value of its stock option grants for the
periods presented above. For stock options issued in 2004, the
Company updated its assumptions related to stock option valua-
tion in order to better reflect expected stock option exercise behav-
ior and expected future stock price volatility. These changes were
based on a detailed review of historical exercise patterns, as well
as a normalization of volatility, both due to upward movement of the
Company’s stock price with improved operating performance dur-
ing the turnaround and were made in consultation with an outside
valuation specialist. Including these changes, the following Black-
Scholes assumptions were used to estimate the grant date fair
value of stock options:
Option Assumptions
2004 2003 2002
Dividend yield
1.4% 3.9% 3.9%
Expected volatility
30.0% 42.4% 40.0%
Risk-free interest rate
3.0% 3.4% 4.7%
Expected option term
5 years 7 years 7 years
Weighted-average fair value
of options at grant date
$ 8.58 $ 6.07 $ 6.32
The Company will begin recognizing stock option expense in fis-
cal 2005 based on the fair value of the award on the date granted.
See discussion under Effect of New Accounting Standards on
page 33.
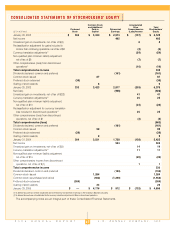
Comprehensive Income/(Loss)
Comprehensive income/(loss) consists of two components: net
income/(loss) and other comprehensive income/(loss). Other com-
prehensive income/(loss) is the sum of currency translation adjust-
ments, unrealized gains/(losses) on investments and non-qualified
plan minimum liability adjustments. Other Comprehensive
Income/(Loss) is presented in the Consolidated Statements of
Stockholders’ Equity.