JCPenney 2004 Annual Report Download - page 15
Download and view the complete annual report
Please find page 15 of the 2004 JCPenney annual report below. You can navigate through the pages in the report by either clicking on the pages listed below, or by using the keyword search tool below to find specific information within the annual report.-
 1
1 -
2
-
3
-
4
-
 5
5 -
 6
6 -
 7
7 -
 8
8 -
 9
9 -
 10
10 -
 11
11 -
 12
12 -
 13
13 -
 14
14 -
 15
15 -
 16
16 -
 17
17 -
 18
18 -
 19
19 -
 20
20 -
 21
21 -
 22
22 -
 23
23 -
 24
24 -
 25
25 -
26
-
27
-
28
-
29
-
30
-
31
-
32
-
33
-
34
-
35
-
36
-
37
-
38
-
39
-
40
-
41
-
42
-
43
-
44
-
45
-
46
-
47
-
48
-
49
-
50
-
51
-
52
-
53
-
54
-
55
-
56
 |
 |
J.C. PENNEY COMPANY, INC.2 004 ANNUAL REPORT
Management’s Discussion and Analysis of Financial Condition and Results of Operations
13
fundamental part of the Company’s store operations.
While this ratio is not intended to be a substitute for the compa-
rable GAAP measure, management believes that this provides a
more comprehensive and realistic view of financial leverage. Debt
investors and the credit rating agencies also consider off-balance
sheet debt when evaluating financial leverage.
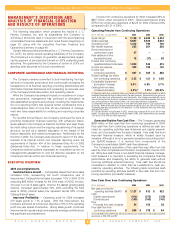
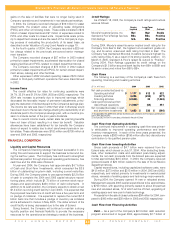
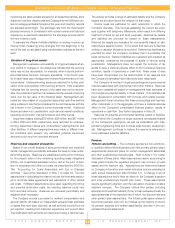
Debt percent to total capital, both including and excluding the
impact of PVOL, is as follows:
($ in millions)
2004 2003 2002
Long-term debt(1)
$ 3,923 $ 5,356 $ 5,173
Short-term debt
22 18 13
Total debt
3,945 5,374 5,186
PVOL
711 657 659
Total debt, including PVOL
4,656 6,031 5,845
Consolidated equity
4,856 5,425 6,370
Total capital(2)
$ 9,512 $ 11,456 $ 12,215
Debt percent to total capital
44.8%(3) 49.8% 44.9%
Debt percent to total capital,
including PVOL
48.9%(3) 52.6% 47.9%
(1) Includes current maturities, capital leases and other.
(2) Eckerd PVOL of $3.3 billion and $2.9 billion for 2003 and 2002, respectively, and securitization of
receivables of approximately $200 million for both 2003 and 2002 have been excluded due to Eckerd
being reported as a discontinued operation.
(3) Assuming the completion of $1 billion of common stock repurchases in the 2004 Capital Structure
Repositioning Plan, debt percent to total capital would be 50.9% and debt percent to total capital, includ-
ing PVOL, would be 55.0%.
The Company’s capital structure in 2004 was positively impacted
by improved earnings and $599 million of positive free cash flow
generated from continuing operations. The Eckerd sale and the sub-
sequent capital structure repositioning plan also served to strength-
en the Company’s financial position. Going forward, the financing
strategy is well-positioned to support the Company’s business plans.
In addition to preserving strong liquidity and financial flexibility, man-
agement will continue to evaluate opportunities to deliver value to
stockholders, strengthen the financial position and improve the cred-
it rating profile in support of its objective to restore the Company’s
credit ratings to an investment-grade level.
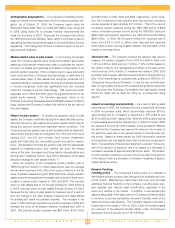
Working Capital
($ in millions)
2004 2003
Current assets
$ 8,427 $ 6,590
Less: Current liabilities
(3,447) (3,754)
Working capital
$ 4,980 $ 2,836
Working capital increased approximately $2.2 billion at year-end
2004 to $5.0 billion compared to $2.8 billion at year-end 2003. This is
primarily the result of a net increase in Cash and Short-Term Investments
from better operating performance that generated approximately $600
million of free cash flow, along with the proceeds from the Eckerd
sale.
Total LIFO inventory was $3,169 million at the end of 2004 compared
with $3,156 million at the end of 2003. FIFO merchandise inventory was
$3,194 million at the end of 2004, basically flat with last year’s $3,199
million. After an effective transition from fall and holiday assortments,
the Company was well positioned with fresh merchandise for the Spring
season. Inventory reflected a good balance among seasonal, basics
and key items. Using new systems and the network of store distribu-
tion centers, the Company has continued to enhance its ability to allo-
cate and flow merchandise to stores in-season by recognizing sales
trends earlier and accelerating receipts, replenishing individual stores
based on rates of sale and consistently providing high in-stock levels in
basics and advertised items. This continued improvement of inventory
management has helped to drive more profitable sales.
Credit Agreement
The Company has a $1.5 billion revolving credit agreement (cred-
it facility) that is scheduled to expire in May 2005. Indebtedness
incurred under the credit facility is collateralized by all eligible
domestic inventory, as defined in the credit facility agreement. This
credit facility provides the Company with an additional source of liq-
uidity for working capital needs and letter of credit support. During
2004, the credit facility was amended to permit the sale of Eckerd
Corporation and its affiliates and assets, allow a broader range of
cash investments and permit issuing banks to extend maturities of
certain letters of credit past the expiration of the credit facility as long
as they are collateralized with cash at that time. No borrowings have
been made under this credit facility, other than the issuance of import
and standby letters of credit, which totaled $153 million as of year-
end 2004. The Company was in compliance with all financial
covenants of the credit facility as of January 29, 2005. See further
discussion of these covenants below.
As discussed previously, the Company is planning to replace its
$1.5 billion credit facility with a new $1.2 billion credit facility in April
2005. The dollar amount of the credit facility is being decreased due
to the Eckerd sale. It is expected that the new credit facility will have
no collateral requirement and provide adequate liquidity for the
Company’s peak seasonal working capital needs.
Debt Covenants and Other
Under the $1.5 billion credit facility discussed above, the Company
is required to maintain an asset coverage ratio, defined as eligible
inventory to total revolving credit exposure, of at least 1.75 to 1.0.
Given that there were no borrowings other than the issuance of letters
of credit, this ratio was 20.3 to 1.0 at year-end 2004, far exceeding the
requirement.
Additionally, the $1.5 billion credit facility includes a leverage ratio
covenant, which consists of a maximum ratio of total debt to consoli-
dated earnings before interest, taxes, depreciation and amortization
(EBITDA, as defined in the credit agreement), as measured on a trail-
ing four-quarters basis, calculated at each quarter end. As of year-
end 2004, the actual leverage ratio was 2.14 to 1.0, well within the
prescribed limit of 3.75 to 1.0.
The Company also has indentures covering approximately $275
million of long-term debt that contain a financial covenant requiring
the Company to have a minimum of 200% net tangible assets to sen-
ior funded indebtedness (as defined in the respective indentures).
These indentures permit the Company to issue additional long-term
debt if it is in compliance with the covenant. At year-end 2004, the
Company’s percent of net tangible assets to senior funded indebted-
ness was 302%.
The Company’s liquidity is enhanced by the fact that the current
debt portfolio and material lease agreements contain no provisions
that could trigger acceleration of payments or collateral support in the
event of adverse changes in the Company’s financial condition.