Holiday Inn 2014 Annual Report Download - page 51
Download and view the complete annual report
Please find page 51 of the 2014 Holiday Inn annual report below. You can navigate through the pages in the report by either clicking on the pages listed below, or by using the keyword search tool below to find specific information within the annual report.-
 1
1 -
2
-
3
-
4
-
5
-
6
-
7
-
8
-
9
-
10
-
11
-
12
-
13
-
14
-
15
-
16
-
17
-
18
-
19
-
20
-
21
-
22
-
23
-
24
-
25
-
26
-
27
-
28
-
29
-
30
-
31
-
32
-
33
-
34
-
35
-
36
-
37
-
38
-
39
-
40
-
 41
41 -
 42
42 -
 43
43 -
 44
44 -
 45
45 -
 46
46 -
 47
47 -
 48
48 -
 49
49 -
 50
50 -
 51
51 -
 52
52 -
 53
53 -
 54
54 -
 55
55 -
 56
56 -
 57
57 -
 58
58 -
 59
59 -
 60
60 -
 61
61 -
62
-
63
-
64
-
65
-
66
-
67
-
68
-
69
-
70
-
71
-
72
-
73
-
74
-
75
-
76
-
77
-
78
-
79
-
80
-
81
-
82
-
83
-
84
-
85
-
86
-
87
-
88
-
89
-
90
-
91
-
92
-
93
-
94
-
95
-
96
-
97
-
98
-
99
-
100
-
101
-
102
-
103
-
104
-
105
-
106
-
107
-
108
-
109
-
110
-
111
-
112
-
113
-
114
-
115
-
116
-
117
-
118
-
119
-
120
-
121
-
122
-
123
-
124
-
125
-
126
-
127
-
128
-
129
-
130
-
131
-
132
-
133
-
134
-
135
-
136
-
137
-
138
-
139
-
140
-
141
-
142
-
143
-
144
-
145
-
146
-
147
-
148
-
149
-
150
-
151
-
152
-
153
-
154
-
155
-
156
-
157
-
158
-
159
-
160
-
161
-
162
-
163
-
164
-
165
-
166
-
167
-
168
-
169
-
170
-
171
-
172
-
173
-
174
-
175
-
176
-
177
-
178
-
179
-
180
-
181
-
182
-
183
-
184
-
185
-
186
-
187
-
188
-
189
-
190
 |
 |

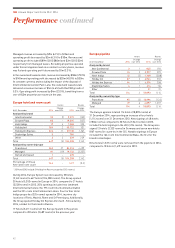
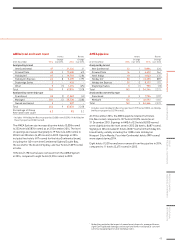
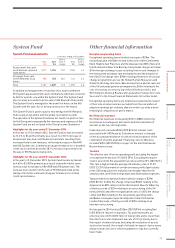
System Fund
System Fund assessments
12 months ended 31 December
2014
$m
2013
$m
2014 vs
2013 %
change
2012
$m
2013 vs
2012 %
change
Assessment fees and
contributions received
from hotels
1,271 1,154 10.1 1,106 4.3
Proceeds from sale
ofIHG RewardsClub
points
196 153 28.1 144 6.3
Total 1,467 1,307 12.2 1,250 4.6
In addition to management or franchise fees, hotels within the
IHG System pay assessments and contributions which are collected
by IHG for specific use within the System Fund. The System Fund
also receives proceeds from the sale of IHG Rewards Club points.
The System Fund is managed for the benefit of hotels in the IHG
System with the objective of driving revenues for the hotels.
The System Fund is used to pay for marketing, the IHG Rewards
Club loyalty programme and the global reservation system.
The operation of the System Fund does not result in a profit or loss
for the Group and consequently the revenues and expenses of the
System Fund are not included in the Group Income Statement.
Highlights for the year ended 31 December 2014
In the year to 31 December 2014, System Fund income increased
by 12.2% to $1,467m primarily as a result of a 10.1% increase in
assessment fees and contributions from hotels resulting from
increased hotel room revenues, reflecting increases in RevPAR
and IHG System size. Continued strong performance in co-branded
credit card schemes drove the 28.1% increase in proceeds from
the sale of IHG Rewards Club points.
Highlights for the year ended 31 December 2013
In the year to 31 December 2013, System Fund income increased
by4.6% to $1,307m primarily as a result of growth in hotel room
revenues due to increases in RevPAR and IHG System size. The
increase in proceeds from the sale of IHG Rewards Club points
mainly reflects the continued strong performance of co-brand
credit cardschemes.
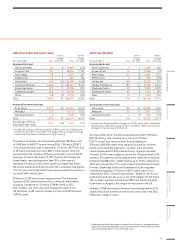
Other financial information
Exceptional operating items
Exceptional operating items totalled a net gain of $29m. The
exceptional gain of $130m related to the sale of InterContinental
Mark Hopkins San Francisco and the disposal of an 80% interest in
InterContinental New York Barclay. Exceptional charges included
$14m foreign exchange losses resulting from recent changes to
the Venezuelan exchange rate mechanisms and the adoption of
the SICAD II exchange rate; $29m relating primarily to structural
change programmes across the Global Human Resources and
Global Technology functions; $6m arising from a partial cash-out
of the UK unfunded pension arrangements; $45m relating to the
cost of securing a restructuring of the UK hotel portfolio; and
$7m Kimpton Hotels & Restaurants acquisition transaction costs.
See note 5 to the Group Financial Statements for further detail.
Exceptional operating items are treated as exceptional by reason
oftheir size or nature and are excluded from the calculation of
adjusted earnings per ordinary share in order to provide a more
meaningful comparison of performance.
Net financial expenses
Net financial expenses increased by $7m to $80m reflecting
an increase in average net debt levels and the translation of
interest on the two sterling bonds.
Financing costs included $2m (2013 $2m) of interest costs
associated with IHG Rewards Club where interest is charged
on the accumulated balance of cash received in advance of the
redemption of points awarded. Financing costs in 2014 also
included $19m (2013 $19m) in respect of the InterContinental
Boston finance lease.
Taxation
The effective rate of tax on operating profit excluding the impact
of exceptional items was 31% (2013 29%). Excluding the impact
of prior year items the equivalent tax rate would be 35% (2013 32%).
This rate is higher than the average UK statutory rate of 21.5%
(2013 23.25%) due mainly to certain overseas profits (particularly
in the US) being subject to statutory rates higher than the UK
statutory rate, unrelieved foreign taxes and disallowable expenses.
Taxation within exceptional items totalled a charge of $29m
(2013 $51m). In 2014 the charge comprised $56m relating to the
disposal of an 80% interest in InterContinental New York Barclay
offset by a credit of $27m relating to a restructuring of the UK
hotel portfolio and other reorganisation costs. In 2013 the charge
comprised $6m relating to the exceptional operating items
and $64m consequent upon the disposal of InterContinental
London Park Lane, offset by a credit of $19m relating to an
internal restructuring.
Net tax paid in 2014 totalled $136m (2013 $97m) including $nil
(2013 $5m) in respect of disposals. Tax paid represents an
effective rate of 23% (2013 16%) on total profits and is lower than
the effective income statement tax rate of 31% primarily due to
the impact of deferred taxes (including the realisation of assets
such as tax losses), the receipt of refunds in respect of prior years
and provisions for tax for which no payment of tax has currently
been made.
49
STRATEGIC REPORT GOVERNANCE
GROUP
FINANCIAL STATEMENTS
PARENT COMPANY
FINANCIAL STATEMENTS
ADDITIONAL
INFORMATION