Holiday Inn 2014 Annual Report Download - page 102
Download and view the complete annual report
Please find page 102 of the 2014 Holiday Inn annual report below. You can navigate through the pages in the report by either clicking on the pages listed below, or by using the keyword search tool below to find specific information within the annual report.-
 1
1 -
2
-
3
-
4
-
5
-
6
-
7
-
8
-
9
-
10
-
11
-
12
-
13
-
14
-
15
-
16
-
17
-
18
-
19
-
20
-
21
-
22
-
23
-
24
-
25
-
26
-
27
-
28
-
29
-
30
-
31
-
32
-
33
-
34
-
35
-
36
-
37
-
38
-
39
-
40
-
41
-
42
-
43
-
44
-
45
-
46
-
47
-
48
-
49
-
50
-
51
-
52
-
53
-
54
-
55
-
56
-
57
-
58
-
59
-
60
-
61
-
62
-
63
-
64
-
65
-
66
-
67
-
68
-
69
-
70
-
71
-
72
-
73
-
74
-
75
-
76
-
77
-
78
-
79
-
80
-
81
-
82
-
83
-
84
-
85
-
86
-
87
-
88
-
89
-
90
-
91
-
 92
92 -
 93
93 -
 94
94 -
 95
95 -
 96
96 -
 97
97 -
 98
98 -
 99
99 -
 100
100 -
 101
101 -
 102
102 -
 103
103 -
 104
104 -
 105
105 -
 106
106 -
 107
107 -
 108
108 -
 109
109 -
 110
110 -
 111
111 -
 112
112 -
113
-
114
-
115
-
116
-
117
-
118
-
119
-
120
-
121
-
122
-
123
-
124
-
125
-
126
-
127
-
128
-
129
-
130
-
131
-
132
-
133
-
134
-
135
-
136
-
137
-
138
-
139
-
140
-
141
-
142
-
143
-
144
-
145
-
146
-
147
-
148
-
149
-
150
-
151
-
152
-
153
-
154
-
155
-
156
-
157
-
158
-
159
-
160
-
161
-
162
-
163
-
164
-
165
-
166
-
167
-
168
-
169
-
170
-
171
-
172
-
173
-
174
-
175
-
176
-
177
-
178
-
179
-
180
-
181
-
182
-
183
-
184
-
185
-
186
-
187
-
188
-
189
-
190
 |
 |
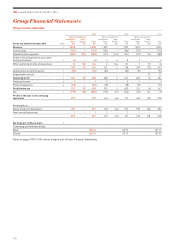
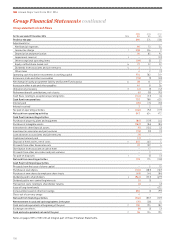
Group income statement
2014 2013 2012
For the year ended 31 December 2014 Note
Before
exceptional
items
$m
Exceptional
items
(note 5)
$m
Total
$m
Before
exceptional
items
$m
Exceptional
items
(note 5)
$m
Total
$m
Before
exceptional
items
$m
Exceptional
items
(note 5)
$m
Total
$m
Revenue 21,858 –1,858 1,903 –1,903 1,835 –1,835
Cost of sales (741) –(741) (784) –(784) (772) –(772)
Administrative expenses (382) (101) (483) (374) (167) (541) (372) (16) (388)
Share of (losses)/profits of associates
and joint ventures 2(4) –(4) 2 6 8 3 – 3
Other operating income and expenses 16 130 146 6166 172 5(11) (6)
747 29 776 753 5758 699 (27) 672
Depreciation and amortisation 2(96) –(96) (85) –(85) (94) –(94)
Impairment reversal 2– – – – – – – 23 23
Operating profit 2651 29 680 668 5673 605 (4) 601
Financial income 63 – 3 5 – 5 3 – 3
Financial expenses 6(83) –(83) (78) –(78) (57) –(57)
Profit before tax 571 29 600 595 5600 551 (4) 547
Tax 7(179) (29) (208) (175) (51) (226) (151) 142 (9)
Profit for the year from continuing
operations 392 –392 420 (46) 374 400 138 538
Attributable to:
Equity holders of the parent 391 –391 418 (46) 372 399 138 537
Non-controlling interest 1 – 1 2 – 2 1 – 1
392 –392 420 (46) 374 400 138 538
Earnings per ordinary share 9
Continuing and total operations:
Basic 158.3¢ 140.9¢ 187.1¢
Diluted 156.4¢ 139.3¢ 183.9¢
Notes on pages 107 to 153 form an integral part of these Financial Statements.
IHG Annual Report and Form 20-F 2014
100
Group Financial Statements