Holiday Inn 2014 Annual Report Download - page 125
Download and view the complete annual report
Please find page 125 of the 2014 Holiday Inn annual report below. You can navigate through the pages in the report by either clicking on the pages listed below, or by using the keyword search tool below to find specific information within the annual report.-
 1
1 -
2
-
3
-
4
-
5
-
6
-
7
-
8
-
9
-
10
-
11
-
12
-
13
-
14
-
15
-
16
-
17
-
18
-
19
-
20
-
21
-
22
-
23
-
24
-
25
-
26
-
27
-
28
-
29
-
30
-
31
-
32
-
33
-
34
-
35
-
36
-
37
-
38
-
39
-
40
-
41
-
42
-
43
-
44
-
45
-
46
-
47
-
48
-
49
-
50
-
51
-
52
-
53
-
54
-
55
-
56
-
57
-
58
-
59
-
60
-
61
-
62
-
63
-
64
-
65
-
66
-
67
-
68
-
69
-
70
-
71
-
72
-
73
-
74
-
75
-
76
-
77
-
78
-
79
-
80
-
81
-
82
-
83
-
84
-
85
-
86
-
87
-
88
-
89
-
90
-
91
-
92
-
93
-
94
-
95
-
96
-
97
-
98
-
99
-
100
-
101
-
102
-
103
-
104
-
105
-
106
-
107
-
108
-
109
-
110
-
111
-
112
-
113
-
114
-
 115
115 -
 116
116 -
 117
117 -
 118
118 -
 119
119 -
 120
120 -
 121
121 -
 122
122 -
 123
123 -
 124
124 -
 125
125 -
 126
126 -
 127
127 -
 128
128 -
 129
129 -
 130
130 -
 131
131 -
 132
132 -
 133
133 -
 134
134 -
 135
135 -
136
-
137
-
138
-
139
-
140
-
141
-
142
-
143
-
144
-
145
-
146
-
147
-
148
-
149
-
150
-
151
-
152
-
153
-
154
-
155
-
156
-
157
-
158
-
159
-
160
-
161
-
162
-
163
-
164
-
165
-
166
-
167
-
168
-
169
-
170
-
171
-
172
-
173
-
174
-
175
-
176
-
177
-
178
-
179
-
180
-
181
-
182
-
183
-
184
-
185
-
186
-
187
-
188
-
189
-
190
 |
 |

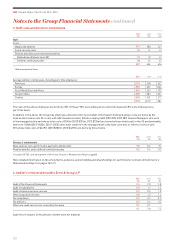
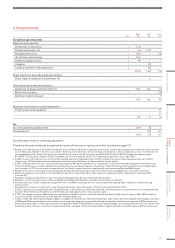
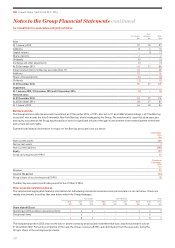
7. Tax continued
Total1Before exceptional items2
2014
%
2013
%
2012
%
2014
%
2013
%
2012
%
Reconciliation of tax charge, including gain on disposal of assets
UK corporation tax at standard rate 21.5 23.3 24.5 21.5 23.3 24.5
Non-deductible expenditure and non-taxable income 4.9 16.6 2.0 1.0 1.9 1.0
Non-recoverable withholding taxes 0.4 1.2 2.0 0.4 1.2 2.0
Net effect of different rates of tax in overseas businesses 11.5 11.6 7.7 12.8 11.9 7.8
Effect of changes in tax rates 0.3 (0.1) (0.3) 0.1 (0.1) (0.1)
Benefit of tax reliefs on which no deferred tax previously recognised (0.4) (15.0) (5.6) (0.3) (1.1) (5.6)
Effect of adjustments to estimated recoverable deferred tax assets 0.2 (6.4) (19.4) (0.2) (4.9) (0.2)
Adjustment to tax charge in respect of prior periods (3.7) (2.2) (9.8) (3.9) (2.1) (2.5)
Deferred tax provision on unremitted earnings –10.5 ––– –
Other –(1.8) 0.4 –(0.6) 0.5
34.7 37.7 1.5 31.4 29.5 27.4
1 Calculated in relation to total profits including exceptional items.
2 Calculated in relation to profits excluding exceptional items.
Tax paid
Total net tax paid during the year of $136m (2013 $97m, 2012 $122m) comprises $136m (2013 $92m, 2012 $119m) paid in respect
of operating activities and $nil (2013 $5m, 2012 $3m) paid in respect of investing activities.
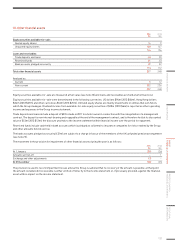
Tax paid represents an effective rate of 23% (2013 16%, 2012 22%) on total profits and is lower than the effective income statement
tax rate of 31% (2013 29%, 2012 27%) primarily due to the impact of deferred taxes (including the realisation of assets such as tax losses),
the receipt of refunds in respect of prior years and provisions for tax for which no payment of tax has currently been made.
Corporation tax liabilities did not arise in 2014 in the UK and are not expected to arise for a number of years thereafter due to expenses
and associated tax losses attributable principally to employment matters, inparticular additional shortfall contributions made to the
UK pension plan in the years 2007 to 2013.
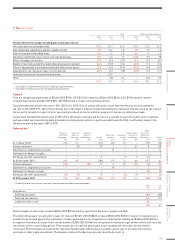
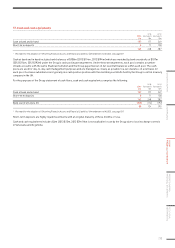
Deferred tax
Property,
plant and
equipment
$m
Deferred
gains on
loan notes
$m
Deferred
gains on
investments
$m
Losses
$m
Employee
benefits
$m
Intangible
assets
$m
Undistributed
earnings of
subsidiaries
$m
Other
short-term
temporary
differences1
$m
Total
$m
At 1 January 2013 236 114 –(215) (63) 33 –(155) (50)
Income statement 1 (8) – 20 2 2 63 888
Statement of comprehensive income – – – – 24 – – – 24
Statement of changes in equity – – – – – – – 4 4
Exchange and other adjustments 3 1 – 9 – (1) 3(14) 1
At 31 December 2013 240 107 –(186) (37) 34 66 (157) 67
Income statement (55) –108 17 322 (19) (3) 73
Statement of comprehensive income – – – – (8) – – 1 (7)
Statement of changes in equity – – – – – – – (3) (3)
Exchange and other adjustments (11) (2) –15 1(4) (3) –(4)
At 31 December 2014 174 105 108 (154) (41) 52 44 (162) 126
1 Primarily relates to provisions, accruals, amortisation and share-based payments.
2014
$m
2013
$m
Analysed as:
Deferred tax assets (87) (108)
Deferred tax liabilities 147 175
Liabilities held for sale 66 –
126 67
Deferred gains on loan notes includes $55m (2013 $55m) which is expected to fall due for payment in 2016.
The deferred tax asset recognised in respect of losses of $154m (2013 $186m) includes $50m (2013 $53m) in respect of capital losses
available to be utilised against the realisation of capital gains which are recognised as a deferred tax liability and $104m (2013 $133m)
in respect of revenue tax losses. Deferred tax assets of $20m (2013 $17m) are recognised in relation to legal entities which suffered a tax
loss in the current or preceding period. These assets are recognised based upon future taxable profit forecasts for the entities
concerned. Deferred gains on investments represent taxable gains which would crystallise upon a sale of a related joint venture,
associate or other equity investment. The balance relates to the Barclay associate described in note 14.
STRATEGIC REPORT GOVERNANCE
GROUP
FINANCIAL STATEMENTS
PARENT COMPANY
FINANCIAL STATEMENTS
ADDITIONAL
INFORMATION
123