Holiday Inn 2014 Annual Report Download - page 107
Download and view the complete annual report
Please find page 107 of the 2014 Holiday Inn annual report below. You can navigate through the pages in the report by either clicking on the pages listed below, or by using the keyword search tool below to find specific information within the annual report.-
 1
1 -
2
-
3
-
4
-
5
-
6
-
7
-
8
-
9
-
10
-
11
-
12
-
13
-
14
-
15
-
16
-
17
-
18
-
19
-
20
-
21
-
22
-
23
-
24
-
25
-
26
-
27
-
28
-
29
-
30
-
31
-
32
-
33
-
34
-
35
-
36
-
37
-
38
-
39
-
40
-
41
-
42
-
43
-
44
-
45
-
46
-
47
-
48
-
49
-
50
-
51
-
52
-
53
-
54
-
55
-
56
-
57
-
58
-
59
-
60
-
61
-
62
-
63
-
64
-
65
-
66
-
67
-
68
-
69
-
70
-
71
-
72
-
73
-
74
-
75
-
76
-
77
-
78
-
79
-
80
-
81
-
82
-
83
-
84
-
85
-
86
-
87
-
88
-
89
-
90
-
91
-
92
-
93
-
94
-
95
-
96
-
 97
97 -
 98
98 -
 99
99 -
 100
100 -
 101
101 -
 102
102 -
 103
103 -
 104
104 -
 105
105 -
 106
106 -
 107
107 -
 108
108 -
 109
109 -
 110
110 -
 111
111 -
 112
112 -
 113
113 -
 114
114 -
 115
115 -
 116
116 -
 117
117 -
118
-
119
-
120
-
121
-
122
-
123
-
124
-
125
-
126
-
127
-
128
-
129
-
130
-
131
-
132
-
133
-
134
-
135
-
136
-
137
-
138
-
139
-
140
-
141
-
142
-
143
-
144
-
145
-
146
-
147
-
148
-
149
-
150
-
151
-
152
-
153
-
154
-
155
-
156
-
157
-
158
-
159
-
160
-
161
-
162
-
163
-
164
-
165
-
166
-
167
-
168
-
169
-
170
-
171
-
172
-
173
-
174
-
175
-
176
-
177
-
178
-
179
-
180
-
181
-
182
-
183
-
184
-
185
-
186
-
187
-
188
-
189
-
190
 |
 |

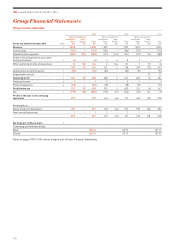
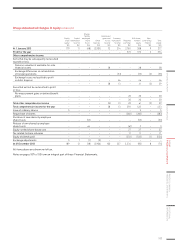
Group statement of financial position
31 December 2014 Note
2014
$m
2013
(restated1)
$m
2012
(restated1)
$m
ASSETS
Property, plant and equipment 10 741 1,169 1,056
Goodwill 12 74 80 93
Intangible assets 13 569 438 354
Investment in associates and joint ventures 14 116 85 84
Trade and other receivables 16 3– –
Retirement benefit assets 25 8799
Other financial assets 15 252 236 155
Non-current tax receivable 34 16 24
Deferred tax assets 787 108 204
Total non-current assets 1,884 2,139 2,069
Inventories 34 4
Trade and other receivables 16 448 423 422
Current tax receivable 412 31
Derivative financial instruments 22 21 2
Other financial assets 15 512 6
Cash and cash equivalents 17 162 248 387
Total current assets 624 700 852
Assets classified as held for sale 11 310 228 534
Total assets 22,818 3,067 3,455
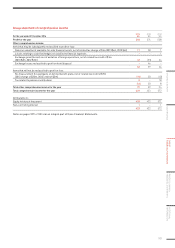
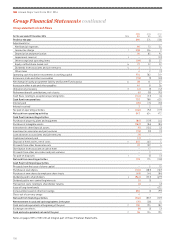
LIABILITIES
Loans and other borrowings 21 (126) (130) (208)
Trade and other payables 18 (769) (748) (709)
Provisions 19 (1) (3) (1)
Current tax payable (47) (47) (54)
Total current liabilities (943) (928) (972)
Loans and other borrowings 21 (1,569) (1,269) (1,242)
Derivative financial instruments 22 –(11) (19)
Retirement benefit obligations 25 (146) (184) (187)
Trade and other payables 18 (627) (574) (563)
Provisions 19 (9) –(1)
Deferred tax liabilities 7(147) (175) (93)
Total non-current liabilities (2,498) (2,213) (2,105)
Liabilities classified as held for sale 11 (94) –(61)
Total liabilities 2(3,535) (3,141) (3,138)
Net (liabilities)/assets (717) (74) 317
EQUITY
Equity share capital 27 178 189 179
Capital redemption reserve 27 12 12 11
Shares held by employee share trusts 27 (35) (38) (48)
Other reserves 27 (2,896) (2,906) (2,901)
Unrealised gains and losses reserve 27 111 100 72
Currency translation reserve 27 269 227 214
Retained earnings 1,636 2,334 2,781
IHG shareholders’ equity (725) (82) 308
Non-controlling interest 27 88 9
Total equity (717) (74) 317
1 Restated for the adoption of ‘Offsetting Financial Assets and Financial Liabilities’ (Amendments to IAS 32), see page 107.
Signed on behalf of the Board
Paul Edgecliffe-Johnson
16 February 2015
Notes on pages 107 to 153 form an integral part of these Financial Statements.
STRATEGIC REPORT GOVERNANCE
GROUP
FINANCIAL STATEMENTS
PARENT COMPANY
FINANCIAL STATEMENTS
ADDITIONAL
INFORMATION
105