Holiday Inn 2014 Annual Report Download - page 142
Download and view the complete annual report
Please find page 142 of the 2014 Holiday Inn annual report below. You can navigate through the pages in the report by either clicking on the pages listed below, or by using the keyword search tool below to find specific information within the annual report.-
 1
1 -
2
-
3
-
4
-
5
-
6
-
7
-
8
-
9
-
10
-
11
-
12
-
13
-
14
-
15
-
16
-
17
-
18
-
19
-
20
-
21
-
22
-
23
-
24
-
25
-
26
-
27
-
28
-
29
-
30
-
31
-
32
-
33
-
34
-
35
-
36
-
37
-
38
-
39
-
40
-
41
-
42
-
43
-
44
-
45
-
46
-
47
-
48
-
49
-
50
-
51
-
52
-
53
-
54
-
55
-
56
-
57
-
58
-
59
-
60
-
61
-
62
-
63
-
64
-
65
-
66
-
67
-
68
-
69
-
70
-
71
-
72
-
73
-
74
-
75
-
76
-
77
-
78
-
79
-
80
-
81
-
82
-
83
-
84
-
85
-
86
-
87
-
88
-
89
-
90
-
91
-
92
-
93
-
94
-
95
-
96
-
97
-
98
-
99
-
100
-
101
-
102
-
103
-
104
-
105
-
106
-
107
-
108
-
109
-
110
-
111
-
112
-
113
-
114
-
115
-
116
-
117
-
118
-
119
-
120
-
121
-
122
-
123
-
124
-
125
-
126
-
127
-
128
-
129
-
130
-
131
-
 132
132 -
 133
133 -
 134
134 -
 135
135 -
 136
136 -
 137
137 -
 138
138 -
 139
139 -
 140
140 -
 141
141 -
 142
142 -
 143
143 -
 144
144 -
 145
145 -
 146
146 -
 147
147 -
 148
148 -
 149
149 -
 150
150 -
 151
151 -
 152
152 -
153
-
154
-
155
-
156
-
157
-
158
-
159
-
160
-
161
-
162
-
163
-
164
-
165
-
166
-
167
-
168
-
169
-
170
-
171
-
172
-
173
-
174
-
175
-
176
-
177
-
178
-
179
-
180
-
181
-
182
-
183
-
184
-
185
-
186
-
187
-
188
-
189
-
190
 |
 |
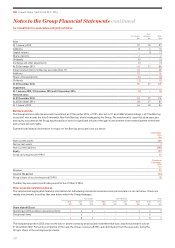
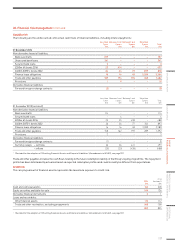
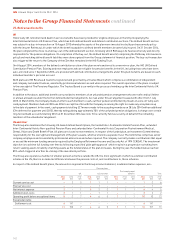
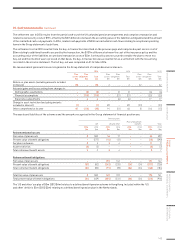
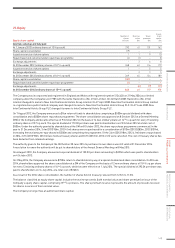
23. Fair value measurement
Fair values
The following table compares carrying amounts and fair values of the Group’s financial assets and liabilities:
2014
2013
(restated¹)
Note
Carrying
value
$m
Fair
value
$m
Carrying
value
$m
Fair
value
$m
Financial assets
Cash and cash equivalents 17 162 162 248 248
Equity securities available-for-sale2 15 144 144 136 136
Loans and receivables:
Other financial assets 15 113 113 112 112
Trade and other financial receivables, excluding prepayments 16 388 388 358 358
Derivatives222 2 2 1 1
809 809 855 855
Financial liabilities
£250m 6% bonds 2016 21 (390) (423) (412) (461)
£400m 3.875% bonds 2022 21 (618) (659) (654) (650)
Finance lease obligations 21 (218) (277) (215) (233)
Unsecured bank loans 21 (359) (359) – –
Secured bank loan 21 (3) (3) (4) (4)
Bank overdrafts 21 (107) (107) (114) (114)
Trade and other payables 18 (1,396) (1,396) (1,322) (1,322)
Derivatives222 – – (11) (11)
Provisions 19 (10) (10) (3) (3)
(3,101) (3,234) (2,735) (2,798)
1 Restated for the adoption of ‘Offsetting Financial Assets and Financial Liabilities’ (Amendments to IAS 32), see page 107.
2 Financial assets and liabilities which are measured at fair value.
There are no other assets or liabilities measured at fair value on a recurring or non-recurring basis, or for which fair value is disclosed.
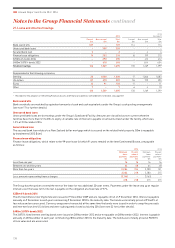
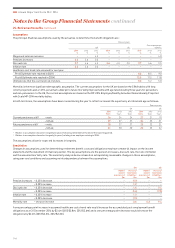
The fair value of cash and cash equivalents and bank overdrafts approximates book value due to the short maturity of the investments
and deposits, and the fair value of other financial assets approximates book value based on prevailing market rates. The fair value of the
secured and unsecured bank loans approximates book value as interest rates reset to market rates on a frequent basis. The fair value of
trade and other receivables, trade and other payables and current provisions approximates to their carrying value, including the future
redemption liability of the Group’s loyalty programme.
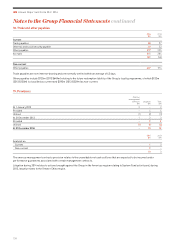
Fair value hierarchy
The following table provides the fair value measurement hierarchy of the above assets and liabilities, other than those with carrying
amounts which are reasonable approximations of their fair values:
Level 1: quoted (unadjusted) prices in active markets for identical assets or liabilities.
Level 2: other techniques for which all inputs which have a significant effect on fair value are observable, either directly orindirectly.
Level 3: techniques which use inputs which have a significant effect on the recorded fair value that are not based on observable marketdata.
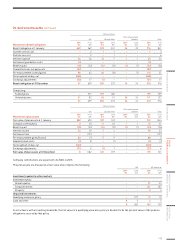
2014 2013
Level 1
$m
Level 2
$m
Level 3
$m
Total
$m
Level 1
$m
Level 2
$m
Level 3
$m
Total
$m
Assets
Equity securities available-for-sale:
Quoted equity shares 16 – – 16 9 – – 9
Unquoted equity shares – – 128 128 – – 127 127
Derivatives –2–2 – 1 – 1
Liabilities
£250m 6% bonds 2016 (423) – – (423) (461) – – (461)
£400m 3.875% bonds 2022 (659) – – (659) (650) – – (650)
Finance lease obligations –(277) –(277) –(233) –(233)
Derivatives –––– –(11) –(11)
There were no transfers between Level 1 and Level 2 fair value measurements during the year and no transfers into and out of Level 3.
continuedNotes to the Group Financial Statements
IHG Annual Report and Form 20-F 2014
140