Holiday Inn 2014 Annual Report Download - page 43
Download and view the complete annual report
Please find page 43 of the 2014 Holiday Inn annual report below. You can navigate through the pages in the report by either clicking on the pages listed below, or by using the keyword search tool below to find specific information within the annual report.-
 1
1 -
2
-
3
-
4
-
5
-
6
-
7
-
8
-
9
-
10
-
11
-
12
-
13
-
14
-
15
-
16
-
17
-
18
-
19
-
20
-
21
-
22
-
23
-
24
-
25
-
26
-
27
-
28
-
29
-
30
-
31
-
32
-
 33
33 -
 34
34 -
 35
35 -
 36
36 -
 37
37 -
 38
38 -
 39
39 -
 40
40 -
 41
41 -
 42
42 -
 43
43 -
 44
44 -
 45
45 -
 46
46 -
 47
47 -
 48
48 -
 49
49 -
 50
50 -
 51
51 -
 52
52 -
 53
53 -
54
-
55
-
56
-
57
-
58
-
59
-
60
-
61
-
62
-
63
-
64
-
65
-
66
-
67
-
68
-
69
-
70
-
71
-
72
-
73
-
74
-
75
-
76
-
77
-
78
-
79
-
80
-
81
-
82
-
83
-
84
-
85
-
86
-
87
-
88
-
89
-
90
-
91
-
92
-
93
-
94
-
95
-
96
-
97
-
98
-
99
-
100
-
101
-
102
-
103
-
104
-
105
-
106
-
107
-
108
-
109
-
110
-
111
-
112
-
113
-
114
-
115
-
116
-
117
-
118
-
119
-
120
-
121
-
122
-
123
-
124
-
125
-
126
-
127
-
128
-
129
-
130
-
131
-
132
-
133
-
134
-
135
-
136
-
137
-
138
-
139
-
140
-
141
-
142
-
143
-
144
-
145
-
146
-
147
-
148
-
149
-
150
-
151
-
152
-
153
-
154
-
155
-
156
-
157
-
158
-
159
-
160
-
161
-
162
-
163
-
164
-
165
-
166
-
167
-
168
-
169
-
170
-
171
-
172
-
173
-
174
-
175
-
176
-
177
-
178
-
179
-
180
-
181
-
182
-
183
-
184
-
185
-
186
-
187
-
188
-
189
-
190
 |
 |

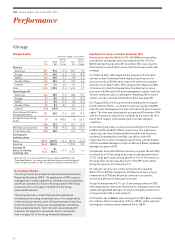
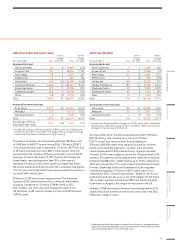
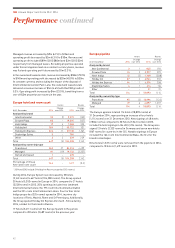
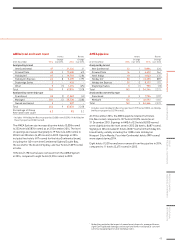
Europe results
12 months ended 31 December
2014
$m
2013
$m
2014 vs
2013 %
change
2012
$m
2013 vs
2012 %
change
Revenue
Franchised 104 104 –91 14.3
Managed 159 156 1.9 147 6.1
Owned and leased 111 140 (20.7) 198 (29.3)
Total 374 400 (6.5) 436 (8.3)
Percentage of
Group Revenue 20.1 21.0 (0.9) 23.8 (2.8)
Operating profit before
exceptional items
Franchised 78 79 (1.3) 65 21.5
Managed 30 30 –32 (6.3)
Owned and leased 14 30 (53.3) 50 (40.0)
122 139 (12.2) 147 (5.4)
Regional overheads (33) (34) 2.9 (35) 2.9
Total 89 105 (15.2) 112 (6.3)
Percentage of Group
Operating profit before
central overheads and
exceptional items
11.0 12.8 (1.8) 14.6 (1.8)
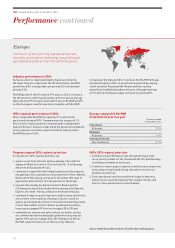
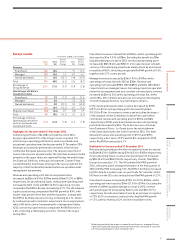
Highlights for the year ended 31 December 2014
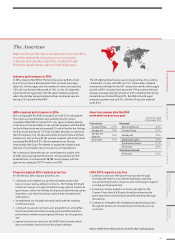
Comprising 647 hotels (104,208 rooms) at the end of 2014,
Europe represented 15% of the Group’s room count and 11%
of the Group’s operating profit before central overheads and
exceptional operating items for the year ended 31 December 2014.
Revenues are primarily generated from hotels in the UK and
continental European gateway cities. The largest proportion of
rooms in Europe are operated under the franchise business model
primarily in the upper midscale segment (Holiday Inn and Holiday
Inn Express). Similarly, in the upscale segment, Crowne Plaza
is predominantly franchised, whereas in the luxury segment the
majority of InterContinental branded hotels are operated under
management agreements.
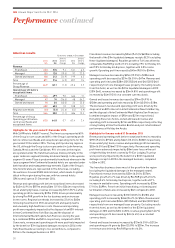
Revenue and operating profit before exceptional items
decreased by $26m (6.5%) to $374m and by $16m (15.2%) to $89m
respectively. On an underlying1 basis, revenue and operating profit
increased by $4m (1.4%) and $3m (3.5%) respectively. Overall,
comparable RevPAR in Europe increased by 5.1%. The UK achieved
a particularly strong comparable RevPAR growth of 8.9%, with
double-digit growth in the first and third quarters. Comparable
RevPAR in Germany was also strong, increasing by 4.1%, driven
by continued growth in domestic output and a rise in employment,
whilst IHG hotels in the Commonwealth of Independent States
(CIS) collectively experienced a comparable RevPAR decline of
4.0%, reflecting a challenging economic climate in the region
during 2014.
Franchised revenue remained flat at $104m, whilst operating profit
decreased by $1m (1.3%) to $78m. Excluding the benefit of a $9m
liquidated damages receipt in 2013, revenue and operating profit
increased by $8m (8.4%) and $8m (11.4%) respectively at constant
currency. This underlying growth was mainly driven by an increase
in royalties of 8.0%, reflecting comparable RevPAR growth of 5.3%,
together with 5.7% rooms growth.
Managed revenue increased by $3m (1.9%) to $159m, whilst
operating profit was flat with 2013 at $30m. Revenue and
operating profit included $90m (2013 $89m) and $2m (2013 $2m)
respectively from managed leases. Excluding properties operated
under this arrangement and on a constant currency basis, revenue
increased by $3m (4.5%), whilst operating profit was flat. At the
end of 2014, IHG commenced a process to restructure the majority
of its UK managed hotels to new franchised contracts.
In the owned and leased estate, revenue decreased by $29m
(20.7%) to $111m and operating profit decreased by $16m
(53.3%) to $14m. At constant currency and excluding the impact
of the disposal of InterContinental London Park Lane (which
contributed revenue and operating profit of $22m and $8m
respectively in 2013), owned and leased revenue and operating
profit both decreased by $7m. These declines were driven by
InterContinental Paris – Le Grand due to the refurbishment
of the Salon Opera ballroom in the first half of 2014. The hotel
delivered revenue and operating profit of $111m and $15m
respectively, a decrease of 5.9% and 34.8% compared to 2013,
whilst RevPAR decreased by 4.7%.
Highlights for the year ended 31 December 2013
Revenue and operating profit before exceptional items decreased
by $36m (8.3%) to $400m and by $7m (6.3%) to $105m respectively.
On an underlying1 basis, revenue and operating profit increased
by $9m (3.4%) and $8m (10.4%) respectively. Overall, RevPAR in
Europe increased by 1.7%. The UK achieved RevPAR growth of
3.0%, with particularly strong performance in the final quarter of
2013 with RevPAR increasing 7.3%. RevPAR in Germany increased
by 0.8% despite a weaker year-on-year trade fair calendar, whilst
IHG hotels in the CIS collectively achieved RevPAR growth of 2.7%.
Franchised revenue increased by $13m (14.3%) to $104m, whilst
operating profit increased by $14m (21.5%) to $79m. Excluding the
benefit of a $9m liquidated damages receipt in 2013, revenue
andoperating profit increased by $4m (4.4%) and $5m (7.7%)
respectively. Growth was mainly driven by an increase in royalties
of 7.0% (6.3% at constant currency) reflecting RevPAR growth
of 1.5%, partly offset by a 0.2% decline in available rooms.
1
Underlying excludes the impact of owned asset disposals, managed leases,
significant liquidated damages and exceptional items translated at constant
currency by applying prior year exchange rates.
41
STRATEGIC REPORT GOVERNANCE
GROUP
FINANCIAL STATEMENTS
PARENT COMPANY
FINANCIAL STATEMENTS
ADDITIONAL
INFORMATION