Holiday Inn 2014 Annual Report Download - page 14
Download and view the complete annual report
Please find page 14 of the 2014 Holiday Inn annual report below. You can navigate through the pages in the report by either clicking on the pages listed below, or by using the keyword search tool below to find specific information within the annual report.-
 1
1 -
2
-
3
-
 4
4 -
 5
5 -
 6
6 -
 7
7 -
 8
8 -
 9
9 -
 10
10 -
 11
11 -
 12
12 -
 13
13 -
 14
14 -
 15
15 -
 16
16 -
 17
17 -
 18
18 -
 19
19 -
 20
20 -
 21
21 -
 22
22 -
 23
23 -
 24
24 -
25
-
26
-
27
-
28
-
29
-
30
-
31
-
32
-
33
-
34
-
35
-
36
-
37
-
38
-
39
-
40
-
41
-
42
-
43
-
44
-
45
-
46
-
47
-
48
-
49
-
50
-
51
-
52
-
53
-
54
-
55
-
56
-
57
-
58
-
59
-
60
-
61
-
62
-
63
-
64
-
65
-
66
-
67
-
68
-
69
-
70
-
71
-
72
-
73
-
74
-
75
-
76
-
77
-
78
-
79
-
80
-
81
-
82
-
83
-
84
-
85
-
86
-
87
-
88
-
89
-
90
-
91
-
92
-
93
-
94
-
95
-
96
-
97
-
98
-
99
-
100
-
101
-
102
-
103
-
104
-
105
-
106
-
107
-
108
-
109
-
110
-
111
-
112
-
113
-
114
-
115
-
116
-
117
-
118
-
119
-
120
-
121
-
122
-
123
-
124
-
125
-
126
-
127
-
128
-
129
-
130
-
131
-
132
-
133
-
134
-
135
-
136
-
137
-
138
-
139
-
140
-
141
-
142
-
143
-
144
-
145
-
146
-
147
-
148
-
149
-
150
-
151
-
152
-
153
-
154
-
155
-
156
-
157
-
158
-
159
-
160
-
161
-
162
-
163
-
164
-
165
-
166
-
167
-
168
-
169
-
170
-
171
-
172
-
173
-
174
-
175
-
176
-
177
-
178
-
179
-
180
-
181
-
182
-
183
-
184
-
185
-
186
-
187
-
188
-
189
-
190
 |
 |
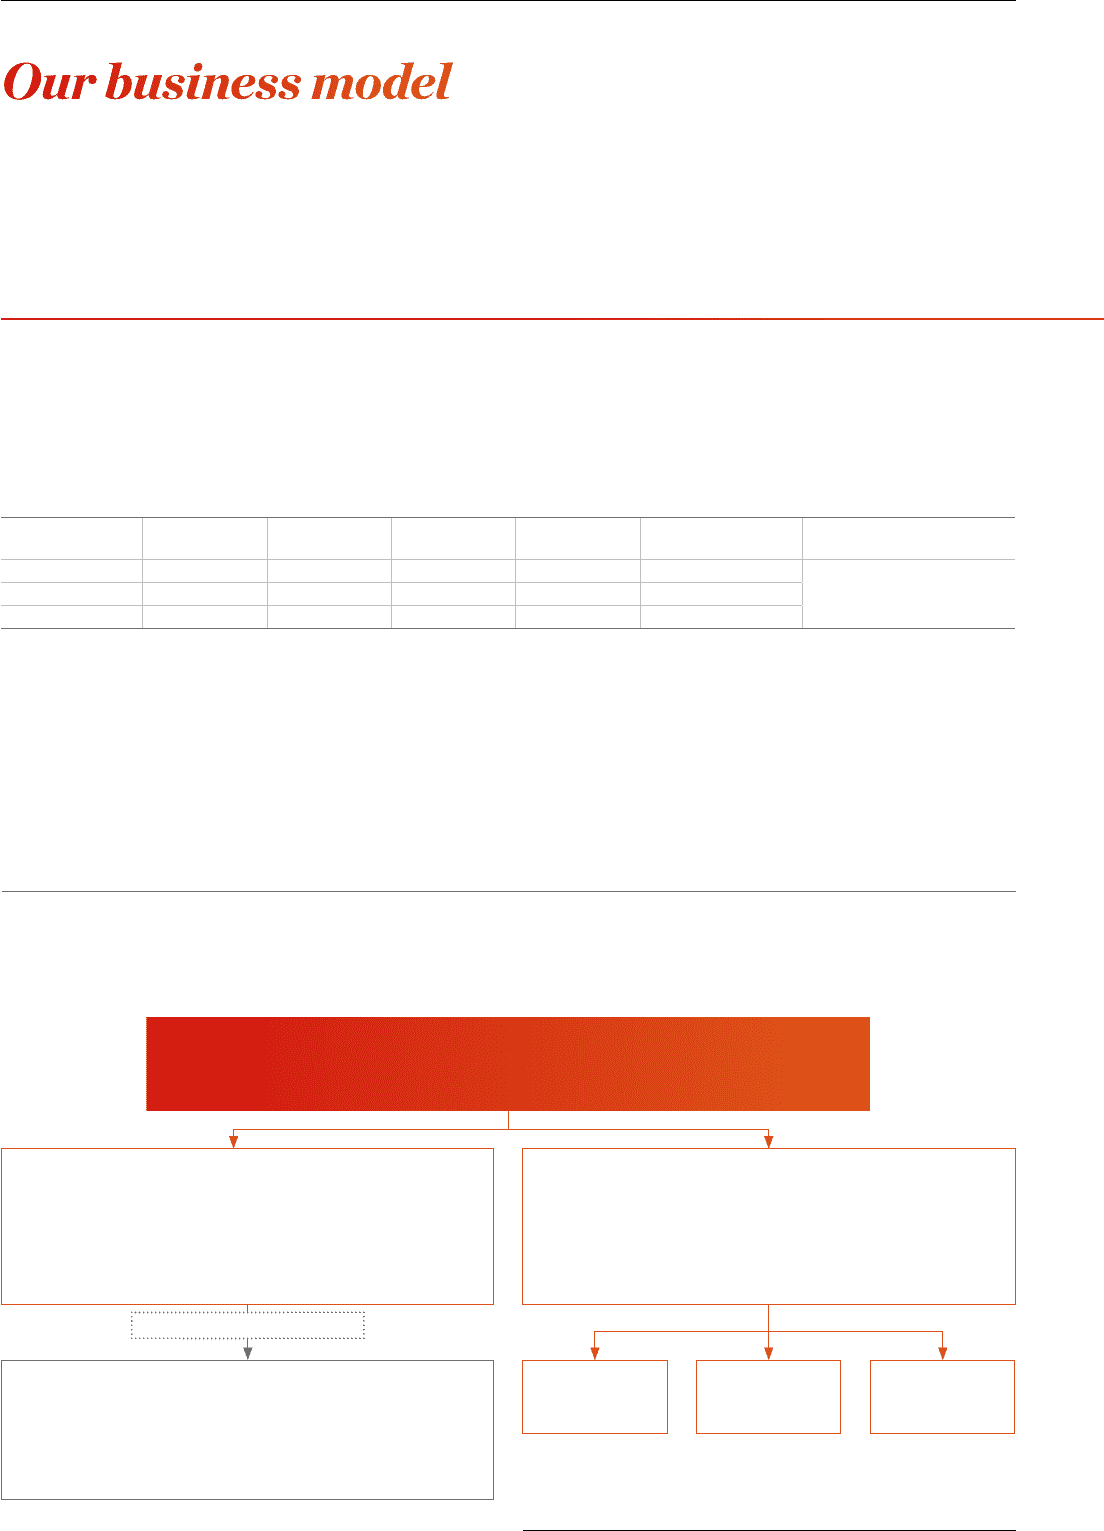
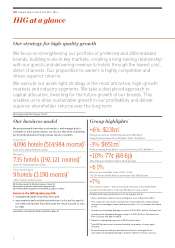
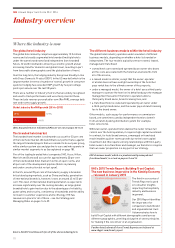
We predominantly franchise our brands to, and manage hotels on behalf
of, third-party owners. Our asset-light strategy enables us to grow our
business whilst generating high returns on invested capital.
‡ Not attributable to IHG – IHG revenues are as described in the
‘IHG revenues’ box.
§ Group revenue excluding owned and leased hotels, managed leases
and significant liquidated damages.
Profit from fee revenues
• After allocating costs, we estimate our margins to be as follows:
• – Franchised 84.6% – Fee margin 44.7%
• – Managed 58.6% – Owned and leased 18.0%
• Not all of our costs can be allocated directly to revenue streams
and these are shown as regional or central infrastructure costs
IHG revenues
• Franchised hotels = RevPAR x rooms x royalty rate
• Managed hotels = Fee % of total revenue plus % of profit
Fee revenues§ – 2014: 61% of our revenue comes from franchise
and management fees
• Owned and leased hotels = All revenue and profits
• Central revenue: Principally technology fees (see page 48)
Marketing IHG Rewards
Club loyalty
programme
Global
reservation
system
System Fund
2014: $1.5bn
• Assessments and contributions paid by hotels
• Proceeds from the sale of IHG Rewards Club points
• No profit or loss for IHG – managed by IHG for the benefit of
hotels within the IHG System
See page 49 for more information
Fee-based margins: 2014: 44.7%
Total Gross Revenue
For our:
• Franchised hotels
= total rooms revenue‡
• Managed hotels
= total hotels revenue‡
• Owned and leased hotels
= total revenue
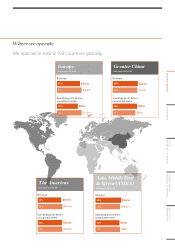
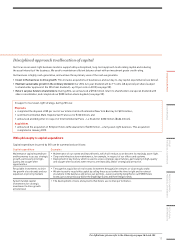
We franchise and/or manage hotels depending largely on market maturity, owner preference and, in certain cases, on the particular
brand. For example, in the US, a mature market, we operate a largely franchised business, working together with our owners to deliver
preferred brands. By contrast, in Greater China, an emerging market, we operate a predominantly managed business where we are
responsible for operating the hotel on behalf of our owners. We adapt this business model by market as necessary, for example, we also
have managed leases (properties structured for legal reasons as operating leases but with the same characteristics as management
contracts), partnerships and joint ventures.
The key differences in our three main models are summarised below:
Number
of hotels
% of our
portfolio
Hotel
ownership
IHG capital
intensity
Employees*Brand ownership,
marketing and distribution
Franchised 4,096 84.6% Third party†Low Third party
IHGManaged 735 15.2% Third party†Low IHG and third party
Owned and leased 9Less than 1% IHG High IHG
* For information on who are our employees and how we invest in our talent, see page 23.
† We are committed to delivering a compelling and preferred offer to our hotels owners through our owner proposition – see page 17.
In 2014, over 90 per cent of our operating profit was generated from our asset-light management and franchise contracts. In addition,
approximately 85 per cent of our fee-based income was derived from hotel revenues, and 15 per cent was principally from management
fees linked to hotel profits.
The asset-light approach, and franchised and managed business model:
• is highly cash-generative, with a high return on capital employed; and
• means IHG benefits from the reduced volatility of fee-based income streams and allows us to focus on growing our fee revenues
and fee margins with limited requirements for IHG’s capital.
IHG Revenue and the System Fund
Third-party hotel owners pay: (i) fees to IHG in relation to licensing of our brands and/or our hotel management services; and
(ii) assessments and contributions which are collected by IHG for specific use within the System Fund.
For definitions, please refer to the Glossary on pages 184 and 185.
12
IHG Annual Report and Form 20-F 2014
Our business model