Holiday Inn 2014 Annual Report Download - page 40
Download and view the complete annual report
Please find page 40 of the 2014 Holiday Inn annual report below. You can navigate through the pages in the report by either clicking on the pages listed below, or by using the keyword search tool below to find specific information within the annual report.-
 1
1 -
2
-
3
-
4
-
5
-
6
-
7
-
8
-
9
-
10
-
11
-
12
-
13
-
14
-
15
-
16
-
17
-
18
-
19
-
20
-
21
-
22
-
23
-
24
-
25
-
26
-
27
-
28
-
29
-
 30
30 -
 31
31 -
 32
32 -
 33
33 -
 34
34 -
 35
35 -
 36
36 -
 37
37 -
 38
38 -
 39
39 -
 40
40 -
 41
41 -
 42
42 -
 43
43 -
 44
44 -
 45
45 -
 46
46 -
 47
47 -
 48
48 -
 49
49 -
 50
50 -
51
-
52
-
53
-
54
-
55
-
56
-
57
-
58
-
59
-
60
-
61
-
62
-
63
-
64
-
65
-
66
-
67
-
68
-
69
-
70
-
71
-
72
-
73
-
74
-
75
-
76
-
77
-
78
-
79
-
80
-
81
-
82
-
83
-
84
-
85
-
86
-
87
-
88
-
89
-
90
-
91
-
92
-
93
-
94
-
95
-
96
-
97
-
98
-
99
-
100
-
101
-
102
-
103
-
104
-
105
-
106
-
107
-
108
-
109
-
110
-
111
-
112
-
113
-
114
-
115
-
116
-
117
-
118
-
119
-
120
-
121
-
122
-
123
-
124
-
125
-
126
-
127
-
128
-
129
-
130
-
131
-
132
-
133
-
134
-
135
-
136
-
137
-
138
-
139
-
140
-
141
-
142
-
143
-
144
-
145
-
146
-
147
-
148
-
149
-
150
-
151
-
152
-
153
-
154
-
155
-
156
-
157
-
158
-
159
-
160
-
161
-
162
-
163
-
164
-
165
-
166
-
167
-
168
-
169
-
170
-
171
-
172
-
173
-
174
-
175
-
176
-
177
-
178
-
179
-
180
-
181
-
182
-
183
-
184
-
185
-
186
-
187
-
188
-
189
-
190
 |
 |
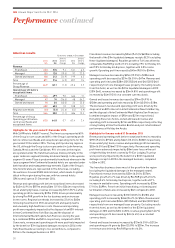
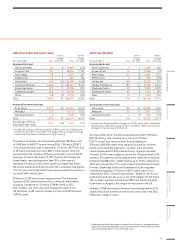
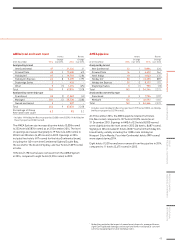
Americas results
12 months ended 31 December
2014
$m
2013
$m
2014 vs
2013 %
change
2012
$m
2013 vs
2012 %
change
Revenue
Franchised 630 576 9.4 541 6.5
Managed 103 128 (19.5) 97 32.0
Owned and leased 138 212 (34.9) 199 6.5
Total 871 916 (4.9) 837 9.4
Percentage of
Group Revenue 46.9 48.1 (1.2) 45.6 2.5
Operating profit before
exceptional items
Franchised 544 499 9.0 466 7.1
Managed 47 74 (36.5) 48 54.2
Owned and leased 18 30 (40.0) 24 25.0
609 603 1.0 538 12.1
Regional overheads (65) (53) (22.6) (52) (1.9)
Total 544 550 (1.1) 486 13.2
Percentage of Group
Operating profit before
central overheads and
exceptional items
67.5 66.8 0.7 63.4 3.4
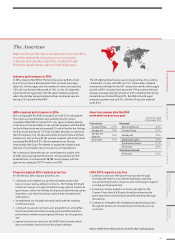
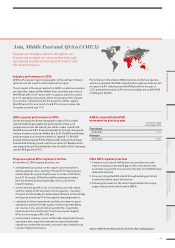
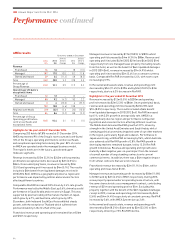
Highlights for the year ended 31 December 2014
With 3,699 hotels (460,017 rooms), The Americas represented 65%
of the Group’s room count and 68% of the Group’s operating profit
before central overheads and exceptional operating items for the
year ended 31 December 2014. The key profit producing region is
the US, although the Group is also represented in Latin America,
Canada, Mexico and the Caribbean. 91% of rooms in the region
are operated under the franchise business model, primarily in the
upper midscale segment (Holiday Inn brand family). In the upscale
segment Crowne Plaza is predominantly franchised whereas in the
luxury segment InterContinental branded hotels are operated under
both franchise and management agreements. Eight of the Group’s
nine hotel brands are represented in The Americas, including
the wellness-focused EVEN Hotels brand, which made its global
debut in the region during the year, with two owned hotels
(296 rooms) open at 31 December 2014.
Revenue and operating profit before exceptional items decreased
by $45m (4.9%) to $871m and by $6m (1.1%) to $544m respectively.
On an underlying1 basis, revenue increased by $71m (9.7%), while
operating profit increased by $39m (7.8%) driven predominantly
by strong RevPAR growth in the fee business and an increase
in net rooms. Regional overheads increased by 22.6% to $65m
following investment in IHG’s development and quality teams
and unusually high healthcare costs. Revenue and operating
profit were negatively impacted by the disposal of an 80% interest
in InterContinental New York Barclay and the disposal of
InterContinental Mark Hopkins San Francisco during the year,
by a combined $95m and $21m respectively compared to 2013.
Conversely, revenue and operating profit were positively impacted
by the benefit of $7m liquidated damages receipts in 2014 in the
franchised business relating to two exited hotels, compared to
$31m in the managed business in 2013.
Franchised revenue increased by $54m (9.4%) to $630m including
the benefit of the $7m liquidated damages receipts (8.2% excluding
these liquidated damages). Royalties growth of 7.6% was driven by
comparable RevPAR growth of 7.2% including 7.9% for Holiday Inn
and 7.0% for Holiday Inn Express, together with 2.0% rooms
growth. Operating profit increased by $45m (9.0%) to $544m.
Managed revenue decreased by $25m (19.5%) to $103m and
operating profit decreased by $27m (36.5%) to $47m. Revenue and
operating profit included $38m (2013 $34m) and $nil (2013 $nil)
respectively from one managed lease property. Excluding results
from this hotel, as well as the $31m liquidated damages in 2013
(2014 $nil), revenue increased by $3m (4.8%) and operating profit
increased by $4m (9.3%) on a constant currency basis.
Owned and leased revenue decreased by $74m (34.9%) to
$138m and operating profit decreased by $12m (40.0%) to $18m.
The decrease in revenue and operating profit were driven by the
disposal of an 80% interest in InterContinental New York Barclay,
and the disposal of InterContinental Mark Hopkins San Francisco
(combined negative impact of $95m and $21m respectively).
Excluding these two hotels, owned and leased revenue and
operating profit increased by $21m and $9m respectively reflecting
strong trading at InterContinental Boston and post refurbishment
performance at Holiday Inn Aruba.
Highlights for the year ended 31 December 2013
Revenue and operating profit before exceptional items increased by
$79m (9.4%) to $916m and by $64m (13.2%) to $550m respectively.
On an underlying1 basis, revenue and operating profit increased by
$52m (6.5%) and $36m (7.5%) respectively. Revenue and operating
profit were adversely impacted by $8m lower fees on the exit
of eight Holiday Inn hotels owned by FelCor Lodging Trust but
were positively impacted by the benefit of a $31m liquidated
damages receipt in 2013 in the managed business, compared
to $3m in 2012.
The franchise business drove most of the growth in the region
(excluding the liquidated damages in the managed estate).
Franchised revenue increased by $35m (6.5%) to $576m.
Royalties growth of 4.7% was driven by RevPAR growth of 3.2%,
including 3.4% for Holiday Inn Express, together with a 0.7%
increase in available rooms. Operating profit increased by $33m
(7.1%) to $499m. Fees from initial franchising, relicensing and
termination of hotels also increased by $6m compared to 2012.
Managed revenue increased by $31m (32.0%) to $128m and
operating profit increased by $26m (54.2%) to $74m. Revenue and
operating profit included $34m (2012 $34m) and $nil (2012 $nil)
respectively from one managed lease property. Excluding results
from this hotel, as well as the benefit of the $31m liquidated
damages in 2013 and the $3m in 2012, revenue grew by $4m (6.7%)
and operating profit decreased by $2m (4.4%) on a constant
currency basis.
Owned and leased revenue increased by $13m (6.5%) to $212m
and operating profit grew by $6m (25.0%) to $30m. The increase
in revenue was driven by RevPAR growth of 6.0%.
38
IHG Annual Report and Form 20-F 2014
Performance continued