HSBC 2003 Annual Report Download - page 4
Download and view the complete annual report
Please find page 4 of the 2003 HSBC annual report below. You can navigate through the pages in the report by either clicking on the pages listed below, or by using the keyword search tool below to find specific information within the annual report.-
 1
1 -
 2
2 -
 3
3 -
 4
4 -
 5
5 -
 6
6 -
 7
7 -
 8
8 -
 9
9 -
 10
10 -
 11
11 -
 12
12 -
 13
13 -
 14
14 -
 15
15 -
16
-
17
-
18
-
19
-
20
-
21
-
22
-
23
-
24
-
25
-
26
-
27
-
28
-
29
-
30
-
31
-
32
-
33
-
34
-
35
-
36
-
37
-
38
-
39
-
40
-
41
-
42
-
43
-
44
-
45
-
46
-
47
-
48
-
49
-
50
-
51
-
52
-
53
-
54
-
55
-
56
-
57
-
58
-
59
-
60
-
61
-
62
-
63
-
64
-
65
-
66
-
67
-
68
-
69
-
70
-
71
-
72
-
73
-
74
-
75
-
76
-
77
-
78
-
79
-
80
-
81
-
82
-
83
-
84
-
85
-
86
-
87
-
88
-
89
-
90
-
91
-
92
-
93
-
94
-
95
-
96
-
97
-
98
-
99
-
100
-
101
-
102
-
103
-
104
-
105
-
106
-
107
-
108
-
109
-
110
-
111
-
112
-
113
-
114
-
115
-
116
-
117
-
118
-
119
-
120
-
121
-
122
-
123
-
124
-
125
-
126
-
127
-
128
-
129
-
130
-
131
-
132
-
133
-
134
-
135
-
136
-
137
-
138
-
139
-
140
-
141
-
142
-
143
-
144
-
145
-
146
-
147
-
148
-
149
-
150
-
151
-
152
-
153
-
154
-
155
-
156
-
157
-
158
-
159
-
160
-
161
-
162
-
163
-
164
-
165
-
166
-
167
-
168
-
169
-
170
-
171
-
172
-
173
-
174
-
175
-
176
-
177
-
178
-
179
-
180
-
181
-
182
-
183
-
184
-
185
-
186
-
187
-
188
-
189
-
190
-
191
-
192
-
193
-
194
-
195
-
196
-
197
-
198
-
199
-
200
-
201
-
202
-
203
-
204
-
205
-
206
-
207
-
208
-
209
-
210
-
211
-
212
-
213
-
214
-
215
-
216
-
217
-
218
-
219
-
220
-
221
-
222
-
223
-
224
-
225
-
226
-
227
-
228
-
229
-
230
-
231
-
232
-
233
-
234
-
235
-
236
-
237
-
238
-
239
-
240
-
241
-
242
-
243
-
244
-
245
-
246
-
247
-
248
-
249
-
250
-
251
-
252
-
253
-
254
-
255
-
256
-
257
-
258
-
259
-
260
-
261
-
262
-
263
-
264
-
265
-
266
-
267
-
268
-
269
-
270
-
271
-
272
-
273
-
274
-
275
-
276
-
277
-
278
-
279
-
280
-
281
-
282
-
283
-
284
-
285
-
286
-
287
-
288
-
289
-
290
-
291
-
292
-
293
-
294
-
295
-
296
-
297
-
298
-
299
-
300
-
301
-
302
-
303
-
304
-
305
-
306
-
307
-
308
-
309
-
310
-
311
-
312
-
313
-
314
-
315
-
316
-
317
-
318
-
319
-
320
-
321
-
322
-
323
-
324
-
325
-
326
-
327
-
328
-
329
-
330
-
331
-
332
-
333
-
334
-
335
-
336
-
337
-
338
-
339
-
340
-
341
-
342
-
343
-
344
-
345
-
346
-
347
-
348
-
349
-
350
-
351
-
352
-
353
-
354
-
355
-
356
-
357
-
358
-
359
-
360
-
361
-
362
-
363
-
364
-
365
-
366
-
367
-
368
-
369
-
370
-
371
-
372
-
373
-
374
-
375
-
376
-
377
-
378
-
379
-
380
-
381
-
382
-
383
-
384
 |
 |

HSBC HOLDINGS PLC
Financial Highlights (continued)
2
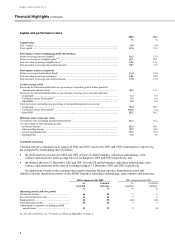
Capital and performance ratios
2003
%
2002
%
Capital ratios
Tier 1 capital ....................................................................................................................................... 8.9 9.0
Total capital ......................................................................................................................................... 12.0 13.3
Performance ratios (excluding goodwill amortisation)
Return on average invested capital9...................................................................................................... 13.7 12.9
Return on average net tangible equity10,11 ............................................................................................. 24.7 20.1
Post-tax return on average tangible assets11.......................................................................................... 1.21 1.11
Post-tax return on average risk-weighted assets11 ................................................................................. 2.07 1.95
Performance ratios (as reported)
Return on average shareholders’ funds3 ............................................................................................... 13.0 12.4
Post-tax return on average total assets3 ................................................................................................ 1.01 0.97
Post-tax return on average risk-weighted assets .................................................................................. 1.78 1.74
Credit coverage ratios
Provisions for bad and doubtful debts as a percentage of operating profits before goodwill
amortisation and provisions ............................................................................................................ 30.5 11.3
Provisions for bad and doubtful debts as a percentage of average gross customer advances:
– in aggregate ...................................................................................................................................... 1.2 0.4
– Consumer Finance (Household)12 ..................................................................................................... 5.2 n/a
– other HSBC ...................................................................................................................................... 0.4 0.4
Total provisions outstanding as a percentage of non-performing loans at year end:
– in aggregate ...................................................................................................................................... 91.0 86.7
– Consumer Finance (Household)12 ..................................................................................................... 110.5 n/a
– other HSBC ...................................................................................................................................... 82.1 86.7
Efficiency and revenue mix ratios
Cost:income ratio (excluding goodwill amortisation)13 ....................................................................... 51.3 56.2
As a percentage of total operating income:
– net interest income ............................................................................................................................ 62.3 58.1
– other operating income ..................................................................................................................... 37.7 41.9
– net fees and commissions ................................................................................................................. 25.3 29.4
– dealing profits ................................................................................................................................... 5.3 4.9
Constant currency
Constant currency comparatives in respect of 2002 and 2001, used in the 2003 and 2002 commentaries respectively,
are computed by retranslating into US dollars:
• the profit and loss accounts for 2002 and 2001 of non-US dollar branches, subsidiary undertakings, joint
ventures and associates at the average rates of exchange for 2003 and 2002 respectively; and
• the balance sheets at 31 December 2002 and 2001 for non-US dollar branches, subsidiary undertakings, joint
ventures and associates at the rates of exchange ruling at 31 December 2003 and 2002 respectively.
No adjustment is made to the exchange rates used to translate foreign currency denominated assets and
liabilities into the functional currency of any HSBC branches, subsidiary undertakings, joint ventures and associates.
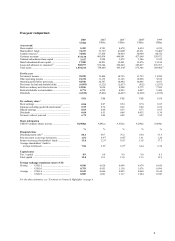
2003 compared with 2002 2002 compared with 2001
As
reported
Constant
currency
As
reported
Constant
currency
%% %%
Operating income and cost growth
Net interest income ................................................ 66 58 56
Fees and commissions (net) ................................... 33 24 54
Dealing profits ....................................................... 66 58 (22) (23)
Total operating income .......................................... 54 46 33
Administrative expenses (excluding goodwill
amortisation) ..................................................... 41 32 2(4)
For the above footnotes, see ‘Footnotes to Financial Highlights’ on page 4.