HSBC 2003 Annual Report Download - page 130
Download and view the complete annual report
Please find page 130 of the 2003 HSBC annual report below. You can navigate through the pages in the report by either clicking on the pages listed below, or by using the keyword search tool below to find specific information within the annual report.-
 1
1 -
2
-
3
-
4
-
5
-
6
-
7
-
8
-
9
-
10
-
11
-
12
-
13
-
14
-
15
-
16
-
17
-
18
-
19
-
20
-
21
-
22
-
23
-
24
-
25
-
26
-
27
-
28
-
29
-
30
-
31
-
32
-
33
-
34
-
35
-
36
-
37
-
38
-
39
-
40
-
41
-
42
-
43
-
44
-
45
-
46
-
47
-
48
-
49
-
50
-
51
-
52
-
53
-
54
-
55
-
56
-
57
-
58
-
59
-
60
-
61
-
62
-
63
-
64
-
65
-
66
-
67
-
68
-
69
-
70
-
71
-
72
-
73
-
74
-
75
-
76
-
77
-
78
-
79
-
80
-
81
-
82
-
83
-
84
-
85
-
86
-
87
-
88
-
89
-
90
-
91
-
92
-
93
-
94
-
95
-
96
-
97
-
98
-
99
-
100
-
101
-
102
-
103
-
104
-
105
-
106
-
107
-
108
-
109
-
110
-
111
-
112
-
113
-
114
-
115
-
116
-
117
-
118
-
119
-
 120
120 -
 121
121 -
 122
122 -
 123
123 -
 124
124 -
 125
125 -
 126
126 -
 127
127 -
 128
128 -
 129
129 -
 130
130 -
 131
131 -
 132
132 -
 133
133 -
 134
134 -
 135
135 -
 136
136 -
 137
137 -
 138
138 -
 139
139 -
 140
140 -
141
-
142
-
143
-
144
-
145
-
146
-
147
-
148
-
149
-
150
-
151
-
152
-
153
-
154
-
155
-
156
-
157
-
158
-
159
-
160
-
161
-
162
-
163
-
164
-
165
-
166
-
167
-
168
-
169
-
170
-
171
-
172
-
173
-
174
-
175
-
176
-
177
-
178
-
179
-
180
-
181
-
182
-
183
-
184
-
185
-
186
-
187
-
188
-
189
-
190
-
191
-
192
-
193
-
194
-
195
-
196
-
197
-
198
-
199
-
200
-
201
-
202
-
203
-
204
-
205
-
206
-
207
-
208
-
209
-
210
-
211
-
212
-
213
-
214
-
215
-
216
-
217
-
218
-
219
-
220
-
221
-
222
-
223
-
224
-
225
-
226
-
227
-
228
-
229
-
230
-
231
-
232
-
233
-
234
-
235
-
236
-
237
-
238
-
239
-
240
-
241
-
242
-
243
-
244
-
245
-
246
-
247
-
248
-
249
-
250
-
251
-
252
-
253
-
254
-
255
-
256
-
257
-
258
-
259
-
260
-
261
-
262
-
263
-
264
-
265
-
266
-
267
-
268
-
269
-
270
-
271
-
272
-
273
-
274
-
275
-
276
-
277
-
278
-
279
-
280
-
281
-
282
-
283
-
284
-
285
-
286
-
287
-
288
-
289
-
290
-
291
-
292
-
293
-
294
-
295
-
296
-
297
-
298
-
299
-
300
-
301
-
302
-
303
-
304
-
305
-
306
-
307
-
308
-
309
-
310
-
311
-
312
-
313
-
314
-
315
-
316
-
317
-
318
-
319
-
320
-
321
-
322
-
323
-
324
-
325
-
326
-
327
-
328
-
329
-
330
-
331
-
332
-
333
-
334
-
335
-
336
-
337
-
338
-
339
-
340
-
341
-
342
-
343
-
344
-
345
-
346
-
347
-
348
-
349
-
350
-
351
-
352
-
353
-
354
-
355
-
356
-
357
-
358
-
359
-
360
-
361
-
362
-
363
-
364
-
365
-
366
-
367
-
368
-
369
-
370
-
371
-
372
-
373
-
374
-
375
-
376
-
377
-
378
-
379
-
380
-
381
-
382
-
383
-
384
 |
 |

HSBC HOLDINGS PLC
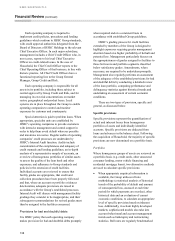
Financial Review (continued)
128
Year ended 31 December
2003 2002 2001
Liabilities and shareholders’ funds
(continued) Average
balance
Interest
expense Cost
Average
balance
Interest
expense Cost
Average
balance
Interest
expense Cost
US$m US$m % US$m US$m % US$m US$m %
CDs and other money market instruments1
Europe HSBC Bank plc ...................... 5,417 151 2.79 2,088 83 3.98 1,257 65 5.17
CCF ........................................ 5,739 162 2.82 4,856 201 4.14 5,547 262 4.72
Hong Kong Hang Seng Bank ..................... 1,399 36 2.57 2,150 65 3.02 2,040 94 4.61
The Hongkong and Shanghai
Banking Corporation .......... 8,257 321 3.89 5,331 258 4.84 3,851 242 6.28
Rest of Asia-
Pacific
The Hongkong and Shanghai
Banking Corporation .......... 3,163 121 3.83 1,659 69 4.16 1,298 67 5.16
HSBC Bank Malaysia
Berhad ................................ 263 8 3.04 148 7 4.73 121 6 4.96
North America HSBC USA Inc. ..................... 1,604 26 1.62 2,286 62 2.71 2,030 92 4.53
Household2 ............................. 5,522 60 1.09 ––– –––
HSBC Bank Canada ............... 3,132 84 2.68 2,168 56 2.58 2,193 104 4.74
HSBC Mexico2 ....................... 4,052 169 4.17 318226.92 –––
South America Brazilian operations ................ 63 12 19.05 53 14 26.42 29 4 13.79
HSBC Bank Argentina S.A. ... –––
105 7 6.67 284 21 7.39
Other operations ................................................. 1,479 59 3.99 763 162.10 475 30.63
40,090 1,209 3.02 21,925 860 3.92 19,125 960 5.02
Loan capital
Europe HSBC Bank plc ...................... 8,790 466 5.30 7,053 463 6.56 10,136 625 6.17
CCF ........................................ 5,686 187 3.29 3,941 164 4.16 2,939 163 5.55
Household2 ............................. 2,230 111 4.98 ––– –––
Hong Kong The Hongkong and Shanghai
Banking Corporation .......... 1,796 80 4.45 1,786 83 4.65 1,805 99 5.48
Rest of Asia-
Pacific
The Hongkong and Shanghai
Banking Corporation .......... 270 17 6.30 151 12 7.95 47 6 12.77
North America HSBC USA Inc. ..................... 3,284 178 5.42 3,396 214 6.30 3,969 280 7.05
Household2 ............................. 71,346 1,779 2.49 ––– –––
HSBC Bank Canada ............... 1,288 66 5.12 1,014 65 6.41 1,272 80 6.29
HSBC Mexico2 ....................... 188 13 6.91 19 2 10.53 – – –
South America Brazilian operations ................ 205 46 22.44 271 44 16.24 208 11 5.29
HSBC Bank Argentina S.A. ... 353 30 8.50 319 62 19.44 245 24 9.80
Other operations ................................................. 9,324 133 1.43 7,148 167 2.34 5,952 264 4.44
104,760 3,106 2.96 25,098 1,276 5.08 26,573 1,552 5.84
1Further analysis is given on page 181.
2Costs annualised on the basis of the period of ownership in the year of acquisition.