HSBC 2003 Annual Report Download - page 285
Download and view the complete annual report
Please find page 285 of the 2003 HSBC annual report below. You can navigate through the pages in the report by either clicking on the pages listed below, or by using the keyword search tool below to find specific information within the annual report.-
 1
1 -
2
-
3
-
4
-
5
-
6
-
7
-
8
-
9
-
10
-
11
-
12
-
13
-
14
-
15
-
16
-
17
-
18
-
19
-
20
-
21
-
22
-
23
-
24
-
25
-
26
-
27
-
28
-
29
-
30
-
31
-
32
-
33
-
34
-
35
-
36
-
37
-
38
-
39
-
40
-
41
-
42
-
43
-
44
-
45
-
46
-
47
-
48
-
49
-
50
-
51
-
52
-
53
-
54
-
55
-
56
-
57
-
58
-
59
-
60
-
61
-
62
-
63
-
64
-
65
-
66
-
67
-
68
-
69
-
70
-
71
-
72
-
73
-
74
-
75
-
76
-
77
-
78
-
79
-
80
-
81
-
82
-
83
-
84
-
85
-
86
-
87
-
88
-
89
-
90
-
91
-
92
-
93
-
94
-
95
-
96
-
97
-
98
-
99
-
100
-
101
-
102
-
103
-
104
-
105
-
106
-
107
-
108
-
109
-
110
-
111
-
112
-
113
-
114
-
115
-
116
-
117
-
118
-
119
-
120
-
121
-
122
-
123
-
124
-
125
-
126
-
127
-
128
-
129
-
130
-
131
-
132
-
133
-
134
-
135
-
136
-
137
-
138
-
139
-
140
-
141
-
142
-
143
-
144
-
145
-
146
-
147
-
148
-
149
-
150
-
151
-
152
-
153
-
154
-
155
-
156
-
157
-
158
-
159
-
160
-
161
-
162
-
163
-
164
-
165
-
166
-
167
-
168
-
169
-
170
-
171
-
172
-
173
-
174
-
175
-
176
-
177
-
178
-
179
-
180
-
181
-
182
-
183
-
184
-
185
-
186
-
187
-
188
-
189
-
190
-
191
-
192
-
193
-
194
-
195
-
196
-
197
-
198
-
199
-
200
-
201
-
202
-
203
-
204
-
205
-
206
-
207
-
208
-
209
-
210
-
211
-
212
-
213
-
214
-
215
-
216
-
217
-
218
-
219
-
220
-
221
-
222
-
223
-
224
-
225
-
226
-
227
-
228
-
229
-
230
-
231
-
232
-
233
-
234
-
235
-
236
-
237
-
238
-
239
-
240
-
241
-
242
-
243
-
244
-
245
-
246
-
247
-
248
-
249
-
250
-
251
-
252
-
253
-
254
-
255
-
256
-
257
-
258
-
259
-
260
-
261
-
262
-
263
-
264
-
265
-
266
-
267
-
268
-
269
-
270
-
271
-
272
-
273
-
274
-
 275
275 -
 276
276 -
 277
277 -
 278
278 -
 279
279 -
 280
280 -
 281
281 -
 282
282 -
 283
283 -
 284
284 -
 285
285 -
 286
286 -
 287
287 -
 288
288 -
 289
289 -
 290
290 -
 291
291 -
 292
292 -
 293
293 -
 294
294 -
 295
295 -
296
-
297
-
298
-
299
-
300
-
301
-
302
-
303
-
304
-
305
-
306
-
307
-
308
-
309
-
310
-
311
-
312
-
313
-
314
-
315
-
316
-
317
-
318
-
319
-
320
-
321
-
322
-
323
-
324
-
325
-
326
-
327
-
328
-
329
-
330
-
331
-
332
-
333
-
334
-
335
-
336
-
337
-
338
-
339
-
340
-
341
-
342
-
343
-
344
-
345
-
346
-
347
-
348
-
349
-
350
-
351
-
352
-
353
-
354
-
355
-
356
-
357
-
358
-
359
-
360
-
361
-
362
-
363
-
364
-
365
-
366
-
367
-
368
-
369
-
370
-
371
-
372
-
373
-
374
-
375
-
376
-
377
-
378
-
379
-
380
-
381
-
382
-
383
-
384
 |
 |

283
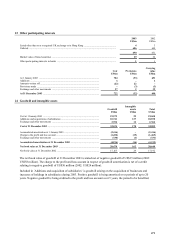
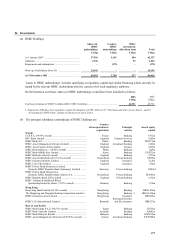
27 Other assets
2003 2002
1
US$m US$m
Bullion .................................................................................................................................................. 2,230 2,962
Assets, including gains, resulting from off-balance-sheet interest rate, exchange rate
and equities contracts which are marked to market .......................................................................... 27,652 21,163
Current taxation recoverable ................................................................................................................. 190 134
Deferred taxation (Note 32) .................................................................................................................. 2,942 1,135
Long-term assurance assets attributable to policyholders ..................................................................... 15,634 10,264
Other accounts ...................................................................................................................................... 14,480 10,105
63,128 45,763
The composition of the net tangible assets relating to long-term assurance and retirement funds is analysed as
follows:
2003 2002
1
US$m US$m
Loans and advances to banks – with HSBC companies ........................................................................ 299 234
Debt securities ...................................................................................................................................... 8,070 4,436
Equity shares ........................................................................................................................................ 5,301 3,598
Other assets .......................................................................................................................................... 2,157 2,131
Prepayments and accrued income ......................................................................................................... 93 78
Other liabilities ..................................................................................................................................... (286
)
(213
)
15,634 10,264
Own shares held ................................................................................................................................... 140 92
Total (Note 31) ..................................................................................................................................... 15,774 10,356
Own shares held are recognised in the own shares held reserve. They have been included above to reconcile to the
long-term assurance liabilities attributable to policyholders in Note 31.
1Figures for 2002 have been restated to reflect the adoption of UITF Abstract 37 ‘Purchases and sales of own shares’, details of which
are set out in Note 1.
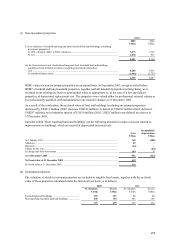
28 Deposits by banks
2003 2002
US$m US$m
Repayable on demand ......................................................................................................................... 25,066 18,093
With agreed maturity dates or periods of notice, by remaining maturity
– 3 months or less but not repayable on demand ............................................................................ 34,313 27,416
– 1 year or less but over 3 months .................................................................................................. 5,299 4,804
– 5 years or less but over 1 year ..................................................................................................... 4,192 1,671
– over 5 years ................................................................................................................................. 1,556 949
70,426 52,933
Amounts include:
Due to associates ............................................................................................................................. 28 214
The composition of deposits by banks on a geographical basis is set out below:
2003 2002
Interest-
bearing
Non
interest-
bearing Total
Interest-
bearing
Non
interest-
bearing Total
US$m US$m US$m US$m US$m US$m
Europe ................................................................. 42,697 4,803 47,500 29,741 4,818 34,559
Hong Kong .......................................................... 3,716 1,061 4,777 1,741 638 2,379
Rest of Asia-Pacific ............................................. 5,700 1,267 6,967 4,674 688 5,362
North America ..................................................... 9,564 790 10,354 9,174 798 9,972
South America ..................................................... 812 16 828 655 6 661
62,489 7,937 70,426 45,985 6,948 52,933
The geographical analysis of deposits is based on the location of the office in which the deposits are recorded and
excludes balances with HSBC companies.