HSBC 2003 Annual Report Download - page 3
Download and view the complete annual report
Please find page 3 of the 2003 HSBC annual report below. You can navigate through the pages in the report by either clicking on the pages listed below, or by using the keyword search tool below to find specific information within the annual report.-
 1
1 -
 2
2 -
 3
3 -
 4
4 -
 5
5 -
 6
6 -
 7
7 -
 8
8 -
 9
9 -
 10
10 -
 11
11 -
 12
12 -
 13
13 -
 14
14 -
15
-
16
-
17
-
18
-
19
-
20
-
21
-
22
-
23
-
24
-
25
-
26
-
27
-
28
-
29
-
30
-
31
-
32
-
33
-
34
-
35
-
36
-
37
-
38
-
39
-
40
-
41
-
42
-
43
-
44
-
45
-
46
-
47
-
48
-
49
-
50
-
51
-
52
-
53
-
54
-
55
-
56
-
57
-
58
-
59
-
60
-
61
-
62
-
63
-
64
-
65
-
66
-
67
-
68
-
69
-
70
-
71
-
72
-
73
-
74
-
75
-
76
-
77
-
78
-
79
-
80
-
81
-
82
-
83
-
84
-
85
-
86
-
87
-
88
-
89
-
90
-
91
-
92
-
93
-
94
-
95
-
96
-
97
-
98
-
99
-
100
-
101
-
102
-
103
-
104
-
105
-
106
-
107
-
108
-
109
-
110
-
111
-
112
-
113
-
114
-
115
-
116
-
117
-
118
-
119
-
120
-
121
-
122
-
123
-
124
-
125
-
126
-
127
-
128
-
129
-
130
-
131
-
132
-
133
-
134
-
135
-
136
-
137
-
138
-
139
-
140
-
141
-
142
-
143
-
144
-
145
-
146
-
147
-
148
-
149
-
150
-
151
-
152
-
153
-
154
-
155
-
156
-
157
-
158
-
159
-
160
-
161
-
162
-
163
-
164
-
165
-
166
-
167
-
168
-
169
-
170
-
171
-
172
-
173
-
174
-
175
-
176
-
177
-
178
-
179
-
180
-
181
-
182
-
183
-
184
-
185
-
186
-
187
-
188
-
189
-
190
-
191
-
192
-
193
-
194
-
195
-
196
-
197
-
198
-
199
-
200
-
201
-
202
-
203
-
204
-
205
-
206
-
207
-
208
-
209
-
210
-
211
-
212
-
213
-
214
-
215
-
216
-
217
-
218
-
219
-
220
-
221
-
222
-
223
-
224
-
225
-
226
-
227
-
228
-
229
-
230
-
231
-
232
-
233
-
234
-
235
-
236
-
237
-
238
-
239
-
240
-
241
-
242
-
243
-
244
-
245
-
246
-
247
-
248
-
249
-
250
-
251
-
252
-
253
-
254
-
255
-
256
-
257
-
258
-
259
-
260
-
261
-
262
-
263
-
264
-
265
-
266
-
267
-
268
-
269
-
270
-
271
-
272
-
273
-
274
-
275
-
276
-
277
-
278
-
279
-
280
-
281
-
282
-
283
-
284
-
285
-
286
-
287
-
288
-
289
-
290
-
291
-
292
-
293
-
294
-
295
-
296
-
297
-
298
-
299
-
300
-
301
-
302
-
303
-
304
-
305
-
306
-
307
-
308
-
309
-
310
-
311
-
312
-
313
-
314
-
315
-
316
-
317
-
318
-
319
-
320
-
321
-
322
-
323
-
324
-
325
-
326
-
327
-
328
-
329
-
330
-
331
-
332
-
333
-
334
-
335
-
336
-
337
-
338
-
339
-
340
-
341
-
342
-
343
-
344
-
345
-
346
-
347
-
348
-
349
-
350
-
351
-
352
-
353
-
354
-
355
-
356
-
357
-
358
-
359
-
360
-
361
-
362
-
363
-
364
-
365
-
366
-
367
-
368
-
369
-
370
-
371
-
372
-
373
-
374
-
375
-
376
-
377
-
378
-
379
-
380
-
381
-
382
-
383
-
384
 |
 |

HSBC HOLDINGS PLC
Financial Highlights
1
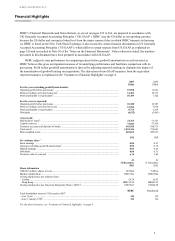
HSBC’ s Financial Statements and Notes thereon, as set out on pages 233 to 366, are prepared in accordance with
UK Generally Accepted Accounting Principles (‘UK GAAP’). HSBC uses the US dollar as its reporting currency
because the US dollar and currencies linked to it form the major currency bloc in which HSBC transacts its business.
As HSBC is listed on the New York Stock Exchange, it also reconciles certain financial information to US Generally
Accepted Accounting Principles (‘US GAAP’ ), which differ in certain respects from UK GAAP as explained on
page 326 and reconciled in Note 50 of the ‘Notes on the Financial Statements’ . Unless otherwise stated, the numbers
presented in this document have been prepared in accordance with UK GAAP.
HSBC judges its own performance by comparing returns before goodwill amortisation on cash invested as
HSBC believes this gives an important measure of its underlying performance and facilitates comparison with its
peer group. Profit before goodwill amortisation is derived by adjusting reported earnings to eliminate the impact of
the amortisation of goodwill arising on acquisitions. The derivation of non-GAAP measures from the equivalent
reported measures is explained in the ‘Footnotes to Financial Highlights’ on page 4.
2003
US$m
2002
US$m
For the year (excluding goodwill amortisation)
Operating profit before provisions1 ...................................................................................................... 19,990 11,641
Profit on ordinary activities before tax2 ................................................................................................ 14,401 10,513
Profit attributable to shareholders2 ........................................................................................................ 10,359 7,102
For the year (as reported)
Operating profit before provisions ........................................................................................................ 18,540 10,787
Profit on ordinary activities before tax ................................................................................................. 12,816 9,650
Profit attributable to shareholders ......................................................................................................... 8,774 6,239
Dividends ............................................................................................................................................. (6,532
)
(5,001
)
At year-end
Shareholders’ funds3 ............................................................................................................................. 74,473 51,765
Capital resources .................................................................................................................................. 74,042 57,430
Customer accounts and deposits by banks ............................................................................................ 643,556 548,371
Total assets3 .......................................................................................................................................... 1,034,216 758,605
Risk-weighted assets ............................................................................................................................ 618,662 430,551
US$ US$
Per ordinary share4
Basic earnings ...................................................................................................................................... 0.84 0.67
Earnings excluding goodwill amortisation5 .......................................................................................... 0.99 0.76
Diluted earnings ................................................................................................................................... 0.83 0.66
Dividends ............................................................................................................................................. 0.60 0.53
Net asset value at year end ................................................................................................................... 6.79 5.46
At
31 December
2003
At
31 December
2002
Share information
US$0.50 ordinary shares in issue .......................................................................................................... 10,960m 9,481m
Market capitalisation ............................................................................................................................ US$172bn US$105bn
Closing market price per ordinary share:
– London .............................................................................................................................................. £8.78 £6.87
– Hong Kong ........................................................................................................................................ HK$122.50 HK$85.25
Closing market price per American Depositary Share (‘ADS’ )6............................................................ US$78.82 US$54.98
HSBC Benchmark
Total shareholder return to 31 December 20037
– over 1 year ......................................................................................................................................... 136 132
– since 1 January 19998......................................................................................................................... 211 126
For the above footnotes, see ‘Footnotes to Financial Highlights’ on page 4.