HSBC 2003 Annual Report Download - page 260
Download and view the complete annual report
Please find page 260 of the 2003 HSBC annual report below. You can navigate through the pages in the report by either clicking on the pages listed below, or by using the keyword search tool below to find specific information within the annual report.-
 1
1 -
2
-
3
-
4
-
5
-
6
-
7
-
8
-
9
-
10
-
11
-
12
-
13
-
14
-
15
-
16
-
17
-
18
-
19
-
20
-
21
-
22
-
23
-
24
-
25
-
26
-
27
-
28
-
29
-
30
-
31
-
32
-
33
-
34
-
35
-
36
-
37
-
38
-
39
-
40
-
41
-
42
-
43
-
44
-
45
-
46
-
47
-
48
-
49
-
50
-
51
-
52
-
53
-
54
-
55
-
56
-
57
-
58
-
59
-
60
-
61
-
62
-
63
-
64
-
65
-
66
-
67
-
68
-
69
-
70
-
71
-
72
-
73
-
74
-
75
-
76
-
77
-
78
-
79
-
80
-
81
-
82
-
83
-
84
-
85
-
86
-
87
-
88
-
89
-
90
-
91
-
92
-
93
-
94
-
95
-
96
-
97
-
98
-
99
-
100
-
101
-
102
-
103
-
104
-
105
-
106
-
107
-
108
-
109
-
110
-
111
-
112
-
113
-
114
-
115
-
116
-
117
-
118
-
119
-
120
-
121
-
122
-
123
-
124
-
125
-
126
-
127
-
128
-
129
-
130
-
131
-
132
-
133
-
134
-
135
-
136
-
137
-
138
-
139
-
140
-
141
-
142
-
143
-
144
-
145
-
146
-
147
-
148
-
149
-
150
-
151
-
152
-
153
-
154
-
155
-
156
-
157
-
158
-
159
-
160
-
161
-
162
-
163
-
164
-
165
-
166
-
167
-
168
-
169
-
170
-
171
-
172
-
173
-
174
-
175
-
176
-
177
-
178
-
179
-
180
-
181
-
182
-
183
-
184
-
185
-
186
-
187
-
188
-
189
-
190
-
191
-
192
-
193
-
194
-
195
-
196
-
197
-
198
-
199
-
200
-
201
-
202
-
203
-
204
-
205
-
206
-
207
-
208
-
209
-
210
-
211
-
212
-
213
-
214
-
215
-
216
-
217
-
218
-
219
-
220
-
221
-
222
-
223
-
224
-
225
-
226
-
227
-
228
-
229
-
230
-
231
-
232
-
233
-
234
-
235
-
236
-
237
-
238
-
239
-
240
-
241
-
242
-
243
-
244
-
245
-
246
-
247
-
248
-
249
-
 250
250 -
 251
251 -
 252
252 -
 253
253 -
 254
254 -
 255
255 -
 256
256 -
 257
257 -
 258
258 -
 259
259 -
 260
260 -
 261
261 -
 262
262 -
 263
263 -
 264
264 -
 265
265 -
 266
266 -
 267
267 -
 268
268 -
 269
269 -
 270
270 -
271
-
272
-
273
-
274
-
275
-
276
-
277
-
278
-
279
-
280
-
281
-
282
-
283
-
284
-
285
-
286
-
287
-
288
-
289
-
290
-
291
-
292
-
293
-
294
-
295
-
296
-
297
-
298
-
299
-
300
-
301
-
302
-
303
-
304
-
305
-
306
-
307
-
308
-
309
-
310
-
311
-
312
-
313
-
314
-
315
-
316
-
317
-
318
-
319
-
320
-
321
-
322
-
323
-
324
-
325
-
326
-
327
-
328
-
329
-
330
-
331
-
332
-
333
-
334
-
335
-
336
-
337
-
338
-
339
-
340
-
341
-
342
-
343
-
344
-
345
-
346
-
347
-
348
-
349
-
350
-
351
-
352
-
353
-
354
-
355
-
356
-
357
-
358
-
359
-
360
-
361
-
362
-
363
-
364
-
365
-
366
-
367
-
368
-
369
-
370
-
371
-
372
-
373
-
374
-
375
-
376
-
377
-
378
-
379
-
380
-
381
-
382
-
383
-
384
 |
 |

HSBC HOLDINGS PLC
Notes on the Financial Statements (continued)
258
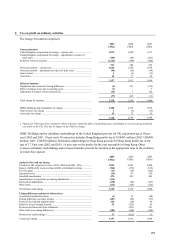
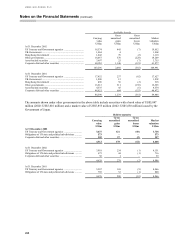
Significant acquisition accounting adjustments arose because certain acquired assets and liabilities were revalued to
their fair value on the purchase of Household and HSBC Mexico. The difference between the fair value of assets and
liabilities, which is included in the accounts, and the previous book value is amortised to the profit and loss account
over the life of the relevant assets and liabilities. The amortisation resulted in a credit to the profit and loss account
of US$957 million and there is no tax associated with this adjustment to net income, which therefore reduces the
effective tax rate for the year. Although similar adjustments arose in prior years the effect was not significant and is
included in ‘Other items’ above.
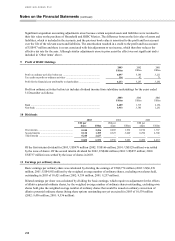
9 Profit of HSBC Holdings
2003 2002 2001
US$m US$m US$m
Profit on ordinary activities before tax ........................................................... 6,097 5,185 3,211
Tax credit on profit on ordinary activities ...................................................... 116 82 71
Profit for the financial year attributable to shareholders ................................. 6,213 5,267 3,282
Profit on ordinary activities before tax includes dividend income from subsidiary undertakings for the years ended
31 December as follows:
2003 2002 2001
US$m US$m US$m
Bank ............................................................................................................... 2,409 1,715 2,156
Non-bank ....................................................................................................... 3,933 3,745 1,251
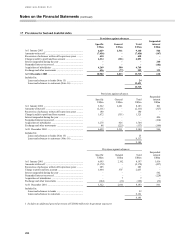
10 Dividends
2003 2002 2001
US$ per
share US$m
US$ per
share US$m
US$ per
share US$m
First interim ....................................................... 0.240 2,596 0.205 1,932 0.190 1,767
Second interim ................................................... 0.120 1,309 0.325 3,069 0.290 2,700
Third interim ...................................................... 0.240 2,627 ––––
0.600 6,532 0.530 5,001 0.480 4,467
Of the first interim dividend for 2003, US$979 million (2002: US$166 million; 2001: US$129 million) was settled
by the issue of shares. Of the second interim dividend for 2002, US$444 million (2001: US$857 million; 2000
US$737 million) was settled by the issue of shares in 2003.
11 Earnings per ordinary share
Basic earnings per ordinary share was calculated by dividing the earnings of US$8,774 million (2002: US$6,239
million; 2001: US$4,992 million) by the weighted average number of ordinary shares, excluding own shares held,
outstanding in 2003 of 10,421 million (2002: 9,339 million; 2001: 9,237 million).
Diluted earnings per share was calculated by dividing the basic earnings, which require no adjustment for the effects
of dilutive potential ordinary shares, by the weighted average number of ordinary shares outstanding, excluding own
shares held, plus the weighted average number of ordinary shares that would be issued on ordinary conversion of
dilutive potential ordinary shares (being share options outstanding not yet exercised) in 2003 of 10,539 million
(2002: 9,436 million; 2001: 9,336 million).