HSBC 2003 Annual Report Download - page 270
Download and view the complete annual report
Please find page 270 of the 2003 HSBC annual report below. You can navigate through the pages in the report by either clicking on the pages listed below, or by using the keyword search tool below to find specific information within the annual report.-
 1
1 -
2
-
3
-
4
-
5
-
6
-
7
-
8
-
9
-
10
-
11
-
12
-
13
-
14
-
15
-
16
-
17
-
18
-
19
-
20
-
21
-
22
-
23
-
24
-
25
-
26
-
27
-
28
-
29
-
30
-
31
-
32
-
33
-
34
-
35
-
36
-
37
-
38
-
39
-
40
-
41
-
42
-
43
-
44
-
45
-
46
-
47
-
48
-
49
-
50
-
51
-
52
-
53
-
54
-
55
-
56
-
57
-
58
-
59
-
60
-
61
-
62
-
63
-
64
-
65
-
66
-
67
-
68
-
69
-
70
-
71
-
72
-
73
-
74
-
75
-
76
-
77
-
78
-
79
-
80
-
81
-
82
-
83
-
84
-
85
-
86
-
87
-
88
-
89
-
90
-
91
-
92
-
93
-
94
-
95
-
96
-
97
-
98
-
99
-
100
-
101
-
102
-
103
-
104
-
105
-
106
-
107
-
108
-
109
-
110
-
111
-
112
-
113
-
114
-
115
-
116
-
117
-
118
-
119
-
120
-
121
-
122
-
123
-
124
-
125
-
126
-
127
-
128
-
129
-
130
-
131
-
132
-
133
-
134
-
135
-
136
-
137
-
138
-
139
-
140
-
141
-
142
-
143
-
144
-
145
-
146
-
147
-
148
-
149
-
150
-
151
-
152
-
153
-
154
-
155
-
156
-
157
-
158
-
159
-
160
-
161
-
162
-
163
-
164
-
165
-
166
-
167
-
168
-
169
-
170
-
171
-
172
-
173
-
174
-
175
-
176
-
177
-
178
-
179
-
180
-
181
-
182
-
183
-
184
-
185
-
186
-
187
-
188
-
189
-
190
-
191
-
192
-
193
-
194
-
195
-
196
-
197
-
198
-
199
-
200
-
201
-
202
-
203
-
204
-
205
-
206
-
207
-
208
-
209
-
210
-
211
-
212
-
213
-
214
-
215
-
216
-
217
-
218
-
219
-
220
-
221
-
222
-
223
-
224
-
225
-
226
-
227
-
228
-
229
-
230
-
231
-
232
-
233
-
234
-
235
-
236
-
237
-
238
-
239
-
240
-
241
-
242
-
243
-
244
-
245
-
246
-
247
-
248
-
249
-
250
-
251
-
252
-
253
-
254
-
255
-
256
-
257
-
258
-
259
-
 260
260 -
 261
261 -
 262
262 -
 263
263 -
 264
264 -
 265
265 -
 266
266 -
 267
267 -
 268
268 -
 269
269 -
 270
270 -
 271
271 -
 272
272 -
 273
273 -
 274
274 -
 275
275 -
 276
276 -
 277
277 -
 278
278 -
 279
279 -
 280
280 -
281
-
282
-
283
-
284
-
285
-
286
-
287
-
288
-
289
-
290
-
291
-
292
-
293
-
294
-
295
-
296
-
297
-
298
-
299
-
300
-
301
-
302
-
303
-
304
-
305
-
306
-
307
-
308
-
309
-
310
-
311
-
312
-
313
-
314
-
315
-
316
-
317
-
318
-
319
-
320
-
321
-
322
-
323
-
324
-
325
-
326
-
327
-
328
-
329
-
330
-
331
-
332
-
333
-
334
-
335
-
336
-
337
-
338
-
339
-
340
-
341
-
342
-
343
-
344
-
345
-
346
-
347
-
348
-
349
-
350
-
351
-
352
-
353
-
354
-
355
-
356
-
357
-
358
-
359
-
360
-
361
-
362
-
363
-
364
-
365
-
366
-
367
-
368
-
369
-
370
-
371
-
372
-
373
-
374
-
375
-
376
-
377
-
378
-
379
-
380
-
381
-
382
-
383
-
384
 |
 |

HSBC HOLDINGS PLC
Notes on the Financial Statements (continued)
268
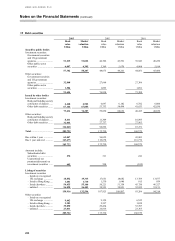
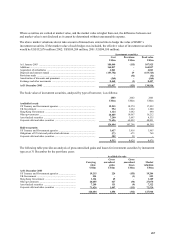
Available-for-sale
Carrying
value
Gross
unrealised
gains
Gross
unrealised
losses
Market
valuation
US$m US$m US$m US$m
At 31 December 2002
US Treasury and Government agencies ............................... 18,574 445 (7
)
19,012
UK Government ................................................................... 1,064 4 – 1,068
Hong Kong Government ...................................................... 1,042 70 (2
)
1,110
Other governments ............................................................... 18,067 370 (228
)
18,209
Asset-backed securities ........................................................ 3,697 25 (7
)
3,715
Corporate debt and other securities ...................................... 60,852 1,146 (121
)
61,877
103,296 2,060 (365
)
104,991
At 31 December 2001
US Treasury and Government agencies ............................... 17,452 237 (62
)
17,627
UK Government ................................................................... 1,880 12 – 1,892
Hong Kong Government ...................................................... 490 30 (2
)
518
Other governments ............................................................... 16,212 311 (158
)
16,365
Asset-backed securities ........................................................ 4,535 45 (6
)
4,574
Corporate debt and other securities ...................................... 48,021 604 (153
)
48,472
88,590 1,239 (381
)
89,448
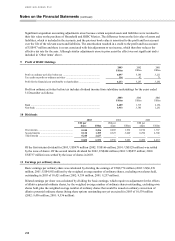
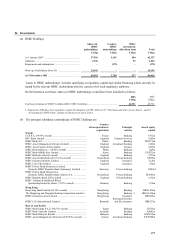
The amounts shown under other governments in the above table include securities with a book value of US$5,847
million (2002: US$5,616 million) and a market value of US$5,853 million (2002: US$5,630 million) issued by the
Government of Japan.
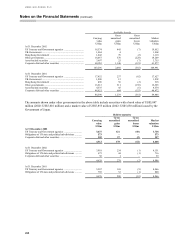
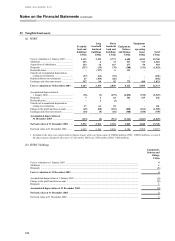
Held-to-maturity
Carrying
value
Gross
unrealised
gains
Gross
unrealised
losses
Market
valuation
US$m US$m US$m US$m
At 31 December 2003
US Treasury and Government agencies ............................ 3,637 121 (40) 3,718
Obligations of US state and political sub-divisions ........... 573 – – 573
Corporate debt and other securities.................................... 302 57 (2) 357
4,512 178 (42) 4,648
At 31 December 2002
US Treasury and Government agencies ............................ 3,918 234 (1
)
4,151
Obligations of US state and political sub-divisions ........... 673 44 (1
)
716
Corporate debt and other securities ................................... 38 1 – 39
4,629 279 (2
)
4,906
At 31 December 2001
US Treasury and Government agencies ............................ 3,907 168 (9
)
4,066
Obligations of US state and political sub-divisions ........... 769 32 (1
)
800
4,676 200 (10
)
4,866