HSBC 2003 Annual Report Download - page 366
Download and view the complete annual report
Please find page 366 of the 2003 HSBC annual report below. You can navigate through the pages in the report by either clicking on the pages listed below, or by using the keyword search tool below to find specific information within the annual report.-
 1
1 -
2
-
3
-
4
-
5
-
6
-
7
-
8
-
9
-
10
-
11
-
12
-
13
-
14
-
15
-
16
-
17
-
18
-
19
-
20
-
21
-
22
-
23
-
24
-
25
-
26
-
27
-
28
-
29
-
30
-
31
-
32
-
33
-
34
-
35
-
36
-
37
-
38
-
39
-
40
-
41
-
42
-
43
-
44
-
45
-
46
-
47
-
48
-
49
-
50
-
51
-
52
-
53
-
54
-
55
-
56
-
57
-
58
-
59
-
60
-
61
-
62
-
63
-
64
-
65
-
66
-
67
-
68
-
69
-
70
-
71
-
72
-
73
-
74
-
75
-
76
-
77
-
78
-
79
-
80
-
81
-
82
-
83
-
84
-
85
-
86
-
87
-
88
-
89
-
90
-
91
-
92
-
93
-
94
-
95
-
96
-
97
-
98
-
99
-
100
-
101
-
102
-
103
-
104
-
105
-
106
-
107
-
108
-
109
-
110
-
111
-
112
-
113
-
114
-
115
-
116
-
117
-
118
-
119
-
120
-
121
-
122
-
123
-
124
-
125
-
126
-
127
-
128
-
129
-
130
-
131
-
132
-
133
-
134
-
135
-
136
-
137
-
138
-
139
-
140
-
141
-
142
-
143
-
144
-
145
-
146
-
147
-
148
-
149
-
150
-
151
-
152
-
153
-
154
-
155
-
156
-
157
-
158
-
159
-
160
-
161
-
162
-
163
-
164
-
165
-
166
-
167
-
168
-
169
-
170
-
171
-
172
-
173
-
174
-
175
-
176
-
177
-
178
-
179
-
180
-
181
-
182
-
183
-
184
-
185
-
186
-
187
-
188
-
189
-
190
-
191
-
192
-
193
-
194
-
195
-
196
-
197
-
198
-
199
-
200
-
201
-
202
-
203
-
204
-
205
-
206
-
207
-
208
-
209
-
210
-
211
-
212
-
213
-
214
-
215
-
216
-
217
-
218
-
219
-
220
-
221
-
222
-
223
-
224
-
225
-
226
-
227
-
228
-
229
-
230
-
231
-
232
-
233
-
234
-
235
-
236
-
237
-
238
-
239
-
240
-
241
-
242
-
243
-
244
-
245
-
246
-
247
-
248
-
249
-
250
-
251
-
252
-
253
-
254
-
255
-
256
-
257
-
258
-
259
-
260
-
261
-
262
-
263
-
264
-
265
-
266
-
267
-
268
-
269
-
270
-
271
-
272
-
273
-
274
-
275
-
276
-
277
-
278
-
279
-
280
-
281
-
282
-
283
-
284
-
285
-
286
-
287
-
288
-
289
-
290
-
291
-
292
-
293
-
294
-
295
-
296
-
297
-
298
-
299
-
300
-
301
-
302
-
303
-
304
-
305
-
306
-
307
-
308
-
309
-
310
-
311
-
312
-
313
-
314
-
315
-
316
-
317
-
318
-
319
-
320
-
321
-
322
-
323
-
324
-
325
-
326
-
327
-
328
-
329
-
330
-
331
-
332
-
333
-
334
-
335
-
336
-
337
-
338
-
339
-
340
-
341
-
342
-
343
-
344
-
345
-
346
-
347
-
348
-
349
-
350
-
351
-
352
-
353
-
354
-
355
-
 356
356 -
 357
357 -
 358
358 -
 359
359 -
 360
360 -
 361
361 -
 362
362 -
 363
363 -
 364
364 -
 365
365 -
 366
366 -
 367
367 -
 368
368 -
 369
369 -
 370
370 -
 371
371 -
 372
372 -
 373
373 -
 374
374 -
 375
375 -
 376
376 -
377
-
378
-
379
-
380
-
381
-
382
-
383
-
384
 |
 |

HSBC HOLDINGS PLC
Notes on the Financial Statements (continued)
364
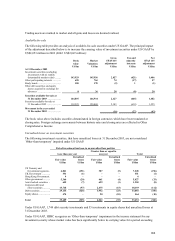
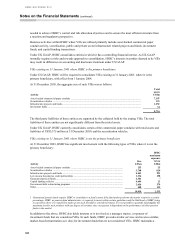
Net initial gains, which represent gross initial gains net of management’s estimate of probable credit losses
under the recourse provisions, and the key economic assumptions used in measuring the net initial gains from
securitisations were as follows:
Auto
Finance
MasterCard/
Visa
Private
Label
Personal
Non-Credit
Card Total
Net initial gains (US$millions) ............................... 40 13 44 38 135
Key economic assumptions1
Weighted average life (in years) ......................... 2.1 0.4 0.7 1.7
Payment speed .................................................... 35.4% 3.3% 74.5% 43.3%
Expected credit losses (annual rate) .................... 6.1% 5.1% 5.7% 12.0%
Discount rate on cash flows ................................ 10.0% 9.0% 10.0% 11.0%
Cost of funds ...................................................... 2.2% 1.8% 1.8% 2.1%
1Weighted-average rates for securitisations entered into during 2003 for securitisations of loans with similar characteristics.
Certain revolving securitisation trusts, such as credit cards, are established at fixed levels and require frequent
sales of new loan balances into the trust to replace loans as they run-off. These replenishments totalled US$25.0
billion in 2003. Net gains (gross gains less estimated credit losses under the recourse provisions) related to these
replenishments were calculated using weighted-average assumptions consistent with those used for calculating
gains on initial securitisations and totalled US$412 million in 2003.
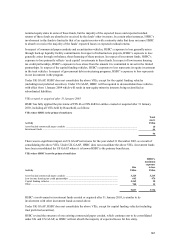
Cash flows received during 2003 from securitisation trusts were as follows:
Real Estate
Secured
Auto
Finance
MasterCard/
Visa
Private
Label
Personal
Non-Credit
Card Total
US$m US$m US$m US$m US$m US$m
Proceeds from initial securitisations ............ – 1,158 350 1,050 2,810 5,368
Servicing fees received ................................ 2 86 149 65 100 402
Other cash flow received on retained
interests1.................................................. 8 50 635 193 132 1,018
1Other cash flows included all cash flows from interest-only strip receivables, excluding servicing fees.