HSBC 2003 Annual Report Download - page 272
Download and view the complete annual report
Please find page 272 of the 2003 HSBC annual report below. You can navigate through the pages in the report by either clicking on the pages listed below, or by using the keyword search tool below to find specific information within the annual report.-
 1
1 -
2
-
3
-
4
-
5
-
6
-
7
-
8
-
9
-
10
-
11
-
12
-
13
-
14
-
15
-
16
-
17
-
18
-
19
-
20
-
21
-
22
-
23
-
24
-
25
-
26
-
27
-
28
-
29
-
30
-
31
-
32
-
33
-
34
-
35
-
36
-
37
-
38
-
39
-
40
-
41
-
42
-
43
-
44
-
45
-
46
-
47
-
48
-
49
-
50
-
51
-
52
-
53
-
54
-
55
-
56
-
57
-
58
-
59
-
60
-
61
-
62
-
63
-
64
-
65
-
66
-
67
-
68
-
69
-
70
-
71
-
72
-
73
-
74
-
75
-
76
-
77
-
78
-
79
-
80
-
81
-
82
-
83
-
84
-
85
-
86
-
87
-
88
-
89
-
90
-
91
-
92
-
93
-
94
-
95
-
96
-
97
-
98
-
99
-
100
-
101
-
102
-
103
-
104
-
105
-
106
-
107
-
108
-
109
-
110
-
111
-
112
-
113
-
114
-
115
-
116
-
117
-
118
-
119
-
120
-
121
-
122
-
123
-
124
-
125
-
126
-
127
-
128
-
129
-
130
-
131
-
132
-
133
-
134
-
135
-
136
-
137
-
138
-
139
-
140
-
141
-
142
-
143
-
144
-
145
-
146
-
147
-
148
-
149
-
150
-
151
-
152
-
153
-
154
-
155
-
156
-
157
-
158
-
159
-
160
-
161
-
162
-
163
-
164
-
165
-
166
-
167
-
168
-
169
-
170
-
171
-
172
-
173
-
174
-
175
-
176
-
177
-
178
-
179
-
180
-
181
-
182
-
183
-
184
-
185
-
186
-
187
-
188
-
189
-
190
-
191
-
192
-
193
-
194
-
195
-
196
-
197
-
198
-
199
-
200
-
201
-
202
-
203
-
204
-
205
-
206
-
207
-
208
-
209
-
210
-
211
-
212
-
213
-
214
-
215
-
216
-
217
-
218
-
219
-
220
-
221
-
222
-
223
-
224
-
225
-
226
-
227
-
228
-
229
-
230
-
231
-
232
-
233
-
234
-
235
-
236
-
237
-
238
-
239
-
240
-
241
-
242
-
243
-
244
-
245
-
246
-
247
-
248
-
249
-
250
-
251
-
252
-
253
-
254
-
255
-
256
-
257
-
258
-
259
-
260
-
261
-
 262
262 -
 263
263 -
 264
264 -
 265
265 -
 266
266 -
 267
267 -
 268
268 -
 269
269 -
 270
270 -
 271
271 -
 272
272 -
 273
273 -
 274
274 -
 275
275 -
 276
276 -
 277
277 -
 278
278 -
 279
279 -
 280
280 -
 281
281 -
 282
282 -
283
-
284
-
285
-
286
-
287
-
288
-
289
-
290
-
291
-
292
-
293
-
294
-
295
-
296
-
297
-
298
-
299
-
300
-
301
-
302
-
303
-
304
-
305
-
306
-
307
-
308
-
309
-
310
-
311
-
312
-
313
-
314
-
315
-
316
-
317
-
318
-
319
-
320
-
321
-
322
-
323
-
324
-
325
-
326
-
327
-
328
-
329
-
330
-
331
-
332
-
333
-
334
-
335
-
336
-
337
-
338
-
339
-
340
-
341
-
342
-
343
-
344
-
345
-
346
-
347
-
348
-
349
-
350
-
351
-
352
-
353
-
354
-
355
-
356
-
357
-
358
-
359
-
360
-
361
-
362
-
363
-
364
-
365
-
366
-
367
-
368
-
369
-
370
-
371
-
372
-
373
-
374
-
375
-
376
-
377
-
378
-
379
-
380
-
381
-
382
-
383
-
384
 |
 |

HSBC HOLDINGS PLC
Notes on the Financial Statements (continued)
270
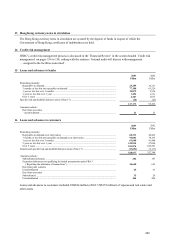
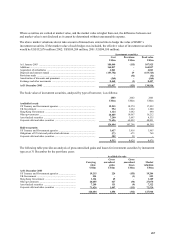
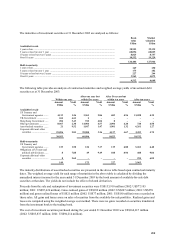
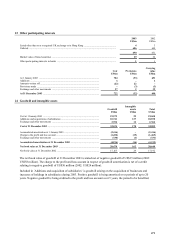
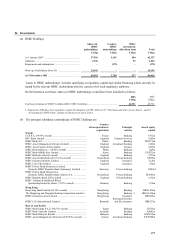
20 Equity shares
2003 2002120011
Carrying
value
Market
valuation
Carrying
value
Market
valuation
Carrying
value
Market
valuation
US$m US$m US$m US$m US$m US$m
Investment securities:
– listed on a recognised
UK exchange .............. 44 65 14 23 87 93
– listed in Hong Kong .... 238 379 241 400 245 564
– listed elsewhere ........... 1,531 1,757 1,163 1,207 1,389 1,436
– unlisted ....................... 3,577 4,016 2,866 3,127 2,426 2,606
5,390 6,217 4,284 4,757 4,147 4,699
Other securities:
– listed on a recognised
UK exchange .............. 129 670 713
–listed in Hong Kong .... 20 974
–listed elsewhere ........... 7,303 2,576 2,405
– unlisted ....................... 37 125 110
12,879 7,664 7,449
Where securities are carried at market value, and the market value is higher than cost, the difference between cost
and market value is not disclosed as it cannot be determined without unreasonable expense.
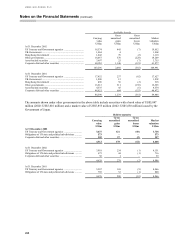
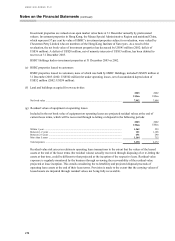
Investment securities
Cost Provisions Book value
US$m US$m US$m
At 1 January 20031 ............................................................................................. 4,659 (375
)
4,284
Additions ............................................................................................................ 5,692 – 5,692
Acquisition of subsidiaries ................................................................................. 701 – 701
Disposals ............................................................................................................ (5,874
)
40 (5,834
)
Provisions made ................................................................................................. –(31
)
(31
)
Provisions written off ......................................................................................... (8
)
8–
Exchange and other movements ......................................................................... 568 10 578
At 31 December 2003 ....................................................................................... 5,738 (348
)
5,390
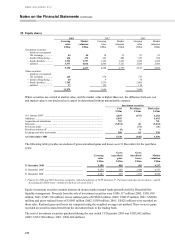
The following table provides an analysis of gross unrealised gains and losses as at 31 December for the past three
years:
Carrying
value
Gross
unrealised
gains
Gross
unrealised
losses
Market
valuation
US$m US$m US$m US$m
31 December 2003 ............................................................ 5,390 858 (31
)
6,217
31 December 20021 ............................................................ 4,284 603 (130
)
4,757
31 December 20011 ............................................................ 4,147 669 (117
)
4,699
1Figures for 2002 and 2001 have been restated to reflect the adoption of UITF Abstracts 37 ‘Purchases and sales of own shares’, and 38
‘Accounting for ESOP trusts’, details of which are set out in Note 1.
Equity investment securities include interests in money market mutual funds primarily held by Household for
liquidity management. Proceeds from the sale of investment securities were US$6,117 million (2002: US$1,980
million; 2001: US$1,796 million). Gross realised gains of US$281 million (2002: US$215 million; 2001: US$290
million) and gross realised losses of US$43 million (2002: US$9 million; 2001: US$25 million) were recorded on
those sales. Realised gains and losses are computed using the weighted average cost method. There were no gains
recorded on securities transferred from the investment book to the trading book.
The cost of investment securities purchased during the year ended 31 December 2003 was US$5,692 million
(2002: US$1,748 million; 2001: US$1,604 million).