HSBC 2003 Annual Report Download - page 271
Download and view the complete annual report
Please find page 271 of the 2003 HSBC annual report below. You can navigate through the pages in the report by either clicking on the pages listed below, or by using the keyword search tool below to find specific information within the annual report.-
 1
1 -
2
-
3
-
4
-
5
-
6
-
7
-
8
-
9
-
10
-
11
-
12
-
13
-
14
-
15
-
16
-
17
-
18
-
19
-
20
-
21
-
22
-
23
-
24
-
25
-
26
-
27
-
28
-
29
-
30
-
31
-
32
-
33
-
34
-
35
-
36
-
37
-
38
-
39
-
40
-
41
-
42
-
43
-
44
-
45
-
46
-
47
-
48
-
49
-
50
-
51
-
52
-
53
-
54
-
55
-
56
-
57
-
58
-
59
-
60
-
61
-
62
-
63
-
64
-
65
-
66
-
67
-
68
-
69
-
70
-
71
-
72
-
73
-
74
-
75
-
76
-
77
-
78
-
79
-
80
-
81
-
82
-
83
-
84
-
85
-
86
-
87
-
88
-
89
-
90
-
91
-
92
-
93
-
94
-
95
-
96
-
97
-
98
-
99
-
100
-
101
-
102
-
103
-
104
-
105
-
106
-
107
-
108
-
109
-
110
-
111
-
112
-
113
-
114
-
115
-
116
-
117
-
118
-
119
-
120
-
121
-
122
-
123
-
124
-
125
-
126
-
127
-
128
-
129
-
130
-
131
-
132
-
133
-
134
-
135
-
136
-
137
-
138
-
139
-
140
-
141
-
142
-
143
-
144
-
145
-
146
-
147
-
148
-
149
-
150
-
151
-
152
-
153
-
154
-
155
-
156
-
157
-
158
-
159
-
160
-
161
-
162
-
163
-
164
-
165
-
166
-
167
-
168
-
169
-
170
-
171
-
172
-
173
-
174
-
175
-
176
-
177
-
178
-
179
-
180
-
181
-
182
-
183
-
184
-
185
-
186
-
187
-
188
-
189
-
190
-
191
-
192
-
193
-
194
-
195
-
196
-
197
-
198
-
199
-
200
-
201
-
202
-
203
-
204
-
205
-
206
-
207
-
208
-
209
-
210
-
211
-
212
-
213
-
214
-
215
-
216
-
217
-
218
-
219
-
220
-
221
-
222
-
223
-
224
-
225
-
226
-
227
-
228
-
229
-
230
-
231
-
232
-
233
-
234
-
235
-
236
-
237
-
238
-
239
-
240
-
241
-
242
-
243
-
244
-
245
-
246
-
247
-
248
-
249
-
250
-
251
-
252
-
253
-
254
-
255
-
256
-
257
-
258
-
259
-
260
-
 261
261 -
 262
262 -
 263
263 -
 264
264 -
 265
265 -
 266
266 -
 267
267 -
 268
268 -
 269
269 -
 270
270 -
 271
271 -
 272
272 -
 273
273 -
 274
274 -
 275
275 -
 276
276 -
 277
277 -
 278
278 -
 279
279 -
 280
280 -
 281
281 -
282
-
283
-
284
-
285
-
286
-
287
-
288
-
289
-
290
-
291
-
292
-
293
-
294
-
295
-
296
-
297
-
298
-
299
-
300
-
301
-
302
-
303
-
304
-
305
-
306
-
307
-
308
-
309
-
310
-
311
-
312
-
313
-
314
-
315
-
316
-
317
-
318
-
319
-
320
-
321
-
322
-
323
-
324
-
325
-
326
-
327
-
328
-
329
-
330
-
331
-
332
-
333
-
334
-
335
-
336
-
337
-
338
-
339
-
340
-
341
-
342
-
343
-
344
-
345
-
346
-
347
-
348
-
349
-
350
-
351
-
352
-
353
-
354
-
355
-
356
-
357
-
358
-
359
-
360
-
361
-
362
-
363
-
364
-
365
-
366
-
367
-
368
-
369
-
370
-
371
-
372
-
373
-
374
-
375
-
376
-
377
-
378
-
379
-
380
-
381
-
382
-
383
-
384
 |
 |

269
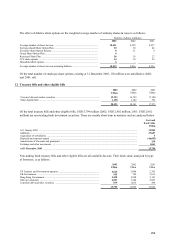
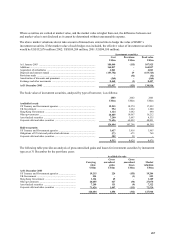
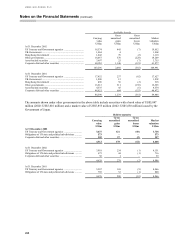
The maturities of investment securities at 31 December 2003 are analysed as follows:
Book
value
Market
valuation
US$m US$m
Available-for-sale
1 year or less ................................................................................................................................... 38,953 39,135
5 years or less but over 1 year ........................................................................................................ 60,096 60,825
10 years or less but over 5 years ..................................................................................................... 8,823 8,757
Over 10 years ................................................................................................................................. 18,532 19,229
126,404 127,946
Held-to-maturity
1 year or less ................................................................................................................................... 149 150
5 years or less but over 1 year ........................................................................................................ 173 182
10 years or less but over 5 years ..................................................................................................... 227 244
Over 10 years ................................................................................................................................. 3,963 4,072
4,512 4,648
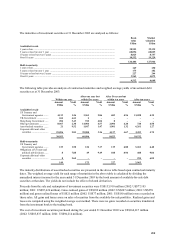
The following table provides an analysis of contractual maturities and weighted average yields of investment debt
securities as at 31 December 2003:
Within one year
After one year but
within five years
After five years but
within ten years After ten years
Amount Yield Amount Yield Amount Yield Amount Yield
US$m % US$m % US$m % US$m %
Available-for-sale
US Treasury and
Government agencies ....... 4,113 1.26 3,361 2.86 683 4.96 11,058 4.35
UK Government .................. 5524.532–––––
Hong Kong Government ..... 204 3.43 912 4.06 8 – – –
Other governments .............. 8,967 2.38 14,904 4.57 2,094 4.20 720 4.58
Asset-backed securities ....... 21 9.52 1,017 1.47 1,901 1.32 4,261 1.27
Corporate debt and other
securities .......................... 25,096 2.81 39,900 3.36 4,137 4.67 2,493 4.75
38,953 60,096 8,823 18,532
Held-to-maturity
US Treasury and
Government agencies ....... 133 1.50 124 7.17 119 6.80 3,261 6.40
Obligations of US state and
political sub-divisions ...... 8 7.88 49 9.49 108 8.94 408 9.04
Corporate debt and other
securities .......................... 8 2.65 – – – – 294 6.05
149 173 227 3,963
The maturity distributions of asset-backed securities are presented in the above table based upon contractual maturity
dates. The weighted average yield for each range of maturities in the above table is calculated by dividing the
annualised interest income for the year ended 31 December 2003 by the book amount of available-for-sale debt
securities at that date. The yields do not include the effect of related derivatives.
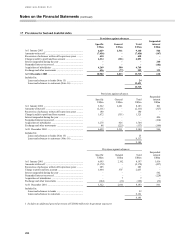
Proceeds from the sale and redemption of investment securities were US$153,910 million (2002: US$77,105
million; 2001: US$87,626 million). Gross realised gains of US$182 million (2002: US$247 million; 2001: US$359
million) and gross realised losses of US$21 million (2002: US$77 million; 2001: US$180 million) were recorded on
those sales. All gains and losses arose on sales of securities from the available-for-sale portfolio. Realised gains and
losses are computed using the weighted average cost method. There were no gains recorded on securities transferred
from the investment book to the trading book.
The cost of investment securities purchased during the year ended 31 December 2003 was US$164,817 million
(2002: US$85,837 million; 2001: US$94,214 million).