HSBC 2003 Annual Report Download - page 255
Download and view the complete annual report
Please find page 255 of the 2003 HSBC annual report below. You can navigate through the pages in the report by either clicking on the pages listed below, or by using the keyword search tool below to find specific information within the annual report.-
 1
1 -
2
-
3
-
4
-
5
-
6
-
7
-
8
-
9
-
10
-
11
-
12
-
13
-
14
-
15
-
16
-
17
-
18
-
19
-
20
-
21
-
22
-
23
-
24
-
25
-
26
-
27
-
28
-
29
-
30
-
31
-
32
-
33
-
34
-
35
-
36
-
37
-
38
-
39
-
40
-
41
-
42
-
43
-
44
-
45
-
46
-
47
-
48
-
49
-
50
-
51
-
52
-
53
-
54
-
55
-
56
-
57
-
58
-
59
-
60
-
61
-
62
-
63
-
64
-
65
-
66
-
67
-
68
-
69
-
70
-
71
-
72
-
73
-
74
-
75
-
76
-
77
-
78
-
79
-
80
-
81
-
82
-
83
-
84
-
85
-
86
-
87
-
88
-
89
-
90
-
91
-
92
-
93
-
94
-
95
-
96
-
97
-
98
-
99
-
100
-
101
-
102
-
103
-
104
-
105
-
106
-
107
-
108
-
109
-
110
-
111
-
112
-
113
-
114
-
115
-
116
-
117
-
118
-
119
-
120
-
121
-
122
-
123
-
124
-
125
-
126
-
127
-
128
-
129
-
130
-
131
-
132
-
133
-
134
-
135
-
136
-
137
-
138
-
139
-
140
-
141
-
142
-
143
-
144
-
145
-
146
-
147
-
148
-
149
-
150
-
151
-
152
-
153
-
154
-
155
-
156
-
157
-
158
-
159
-
160
-
161
-
162
-
163
-
164
-
165
-
166
-
167
-
168
-
169
-
170
-
171
-
172
-
173
-
174
-
175
-
176
-
177
-
178
-
179
-
180
-
181
-
182
-
183
-
184
-
185
-
186
-
187
-
188
-
189
-
190
-
191
-
192
-
193
-
194
-
195
-
196
-
197
-
198
-
199
-
200
-
201
-
202
-
203
-
204
-
205
-
206
-
207
-
208
-
209
-
210
-
211
-
212
-
213
-
214
-
215
-
216
-
217
-
218
-
219
-
220
-
221
-
222
-
223
-
224
-
225
-
226
-
227
-
228
-
229
-
230
-
231
-
232
-
233
-
234
-
235
-
236
-
237
-
238
-
239
-
240
-
241
-
242
-
243
-
244
-
 245
245 -
 246
246 -
 247
247 -
 248
248 -
 249
249 -
 250
250 -
 251
251 -
 252
252 -
 253
253 -
 254
254 -
 255
255 -
 256
256 -
 257
257 -
 258
258 -
 259
259 -
 260
260 -
 261
261 -
 262
262 -
 263
263 -
 264
264 -
 265
265 -
266
-
267
-
268
-
269
-
270
-
271
-
272
-
273
-
274
-
275
-
276
-
277
-
278
-
279
-
280
-
281
-
282
-
283
-
284
-
285
-
286
-
287
-
288
-
289
-
290
-
291
-
292
-
293
-
294
-
295
-
296
-
297
-
298
-
299
-
300
-
301
-
302
-
303
-
304
-
305
-
306
-
307
-
308
-
309
-
310
-
311
-
312
-
313
-
314
-
315
-
316
-
317
-
318
-
319
-
320
-
321
-
322
-
323
-
324
-
325
-
326
-
327
-
328
-
329
-
330
-
331
-
332
-
333
-
334
-
335
-
336
-
337
-
338
-
339
-
340
-
341
-
342
-
343
-
344
-
345
-
346
-
347
-
348
-
349
-
350
-
351
-
352
-
353
-
354
-
355
-
356
-
357
-
358
-
359
-
360
-
361
-
362
-
363
-
364
-
365
-
366
-
367
-
368
-
369
-
370
-
371
-
372
-
373
-
374
-
375
-
376
-
377
-
378
-
379
-
380
-
381
-
382
-
383
-
384
 |
 |

253
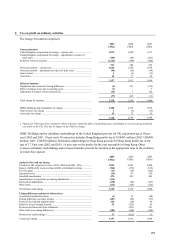
The following amounts would be reflected in the profit and loss account and statement of total consolidated
recognised gains and losses on implementation of FRS 17:
Year ended 31 December
2003 2002
HSBC Bank
(UK) Pension
Scheme
Other
schemes
HSBC Bank
(UK) Pension
Scheme
Other
schemes
US$m US$m US$m US$m
Amount that would be charged to operating profit
Current service cost ...................................................................... 277 215 280 184
Past service cost ........................................................................... –28 ––
Total operating charge .................................................................. 277 243 280 184
Amount that would be credited to other finance income
Expected return on pension scheme assets ................................... 728 304 673 236
Interest on pension scheme liabilities ........................................... (675
)
(277
)
(645
)
(234
)
Net return ..................................................................................... 53 27 28 2
Amount that would be recognised in the statement of total
consolidated recognised gains and losses
Actual return less expected return on pension scheme assets ........ 987 442 (1,825
)
(510
)
Experience gains and losses arising on the scheme liabilities........ (195
)
19 (18
)
95
Changes in assumptions underlying the present value of the
scheme liabilities ...................................................................... (1,978
)
(184
)
402 59
Actuarial gain/(loss) ..................................................................... (1,186
)
277 (1,441
)
(356
)
Movement in deficit in the pension schemes during the year
Deficit in the pension schemes at 1 January ................................. (2,826
)
(719
)
(1,091
)
(654
)
Movement in the year:
Total operating charge .................................................................. (277
)
(243
)
(280
)
(184
)
Contributions ................................................................................ 1,189 548 191 445
Other finance income .................................................................... 53 27 28 2
Actuarial gain/(loss) ..................................................................... (1,186
)
277 (1,441
)
(356
)
Acquisition of subsidiary undertaking .......................................... –(106
)
–(15
)
Exchange and other movements ................................................... (325
)
(36
)
(233
)
43
Deficit in the pension schemes at 31 December ........................... (3,372
)
(252
)
(2,826
)
(719
)
History of experience gains and losses
Difference between expected and actual return on scheme assets:
– amount ....................................................................................... 987 442 (1,825
)
(510
)
– percentage of scheme assets ...................................................... 8% 8% (20%
)
(15%
)
Experience gains and losses arising on scheme liabilities:
– amount ....................................................................................... (195) 19 (18
)
95
– percentage of the present value of the scheme liabilities ........... (1%) 0.4% (0.1%
)
2%
Total amount recognised in the statement of total consolidated
gains and losses:
– amount ....................................................................................... (1,186
)
277 (1,441
)
(356
)
– percentage of the present value of the scheme liabilities ........... (7%
)
5
%
(12%
)
(9%
)
Most of the employees of HSBC Holdings are members of the HSBC Bank (UK) Pension Scheme. HSBC
Holdings is unable to identify the share of the underlying assets and liabilities of this scheme which are
attributable to its employees.
(iii) Post-retirement healthcare benefits
HSBC also provides post-retirement healthcare benefits under schemes, mainly in the United Kingdom and
also in the United States, Canada, Mexico and Brazil. The charge relating to these schemes is US$54
million for the year (2002: US$54 million; 2001: US$39 million). The schemes are unfunded, except for the