HSBC 2003 Annual Report Download - page 165
Download and view the complete annual report
Please find page 165 of the 2003 HSBC annual report below. You can navigate through the pages in the report by either clicking on the pages listed below, or by using the keyword search tool below to find specific information within the annual report.-
 1
1 -
2
-
3
-
4
-
5
-
6
-
7
-
8
-
9
-
10
-
11
-
12
-
13
-
14
-
15
-
16
-
17
-
18
-
19
-
20
-
21
-
22
-
23
-
24
-
25
-
26
-
27
-
28
-
29
-
30
-
31
-
32
-
33
-
34
-
35
-
36
-
37
-
38
-
39
-
40
-
41
-
42
-
43
-
44
-
45
-
46
-
47
-
48
-
49
-
50
-
51
-
52
-
53
-
54
-
55
-
56
-
57
-
58
-
59
-
60
-
61
-
62
-
63
-
64
-
65
-
66
-
67
-
68
-
69
-
70
-
71
-
72
-
73
-
74
-
75
-
76
-
77
-
78
-
79
-
80
-
81
-
82
-
83
-
84
-
85
-
86
-
87
-
88
-
89
-
90
-
91
-
92
-
93
-
94
-
95
-
96
-
97
-
98
-
99
-
100
-
101
-
102
-
103
-
104
-
105
-
106
-
107
-
108
-
109
-
110
-
111
-
112
-
113
-
114
-
115
-
116
-
117
-
118
-
119
-
120
-
121
-
122
-
123
-
124
-
125
-
126
-
127
-
128
-
129
-
130
-
131
-
132
-
133
-
134
-
135
-
136
-
137
-
138
-
139
-
140
-
141
-
142
-
143
-
144
-
145
-
146
-
147
-
148
-
149
-
150
-
151
-
152
-
153
-
154
-
 155
155 -
 156
156 -
 157
157 -
 158
158 -
 159
159 -
 160
160 -
 161
161 -
 162
162 -
 163
163 -
 164
164 -
 165
165 -
 166
166 -
 167
167 -
 168
168 -
 169
169 -
 170
170 -
 171
171 -
 172
172 -
 173
173 -
 174
174 -
 175
175 -
176
-
177
-
178
-
179
-
180
-
181
-
182
-
183
-
184
-
185
-
186
-
187
-
188
-
189
-
190
-
191
-
192
-
193
-
194
-
195
-
196
-
197
-
198
-
199
-
200
-
201
-
202
-
203
-
204
-
205
-
206
-
207
-
208
-
209
-
210
-
211
-
212
-
213
-
214
-
215
-
216
-
217
-
218
-
219
-
220
-
221
-
222
-
223
-
224
-
225
-
226
-
227
-
228
-
229
-
230
-
231
-
232
-
233
-
234
-
235
-
236
-
237
-
238
-
239
-
240
-
241
-
242
-
243
-
244
-
245
-
246
-
247
-
248
-
249
-
250
-
251
-
252
-
253
-
254
-
255
-
256
-
257
-
258
-
259
-
260
-
261
-
262
-
263
-
264
-
265
-
266
-
267
-
268
-
269
-
270
-
271
-
272
-
273
-
274
-
275
-
276
-
277
-
278
-
279
-
280
-
281
-
282
-
283
-
284
-
285
-
286
-
287
-
288
-
289
-
290
-
291
-
292
-
293
-
294
-
295
-
296
-
297
-
298
-
299
-
300
-
301
-
302
-
303
-
304
-
305
-
306
-
307
-
308
-
309
-
310
-
311
-
312
-
313
-
314
-
315
-
316
-
317
-
318
-
319
-
320
-
321
-
322
-
323
-
324
-
325
-
326
-
327
-
328
-
329
-
330
-
331
-
332
-
333
-
334
-
335
-
336
-
337
-
338
-
339
-
340
-
341
-
342
-
343
-
344
-
345
-
346
-
347
-
348
-
349
-
350
-
351
-
352
-
353
-
354
-
355
-
356
-
357
-
358
-
359
-
360
-
361
-
362
-
363
-
364
-
365
-
366
-
367
-
368
-
369
-
370
-
371
-
372
-
373
-
374
-
375
-
376
-
377
-
378
-
379
-
380
-
381
-
382
-
383
-
384
 |
 |

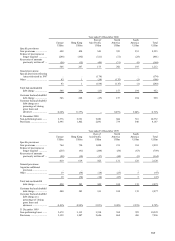
163
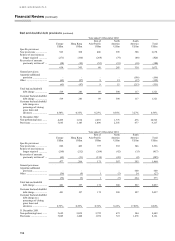
31 December
2003
US$m
31 Decembe
r
2002
US$
m
31 Decembe
r
2001
US$
m
31 Decembe
r
2000
US$
m
31 Decembe
r
1999
US$
m
Loans accounted for on a non-accrual basis
Europe ........................................................................ 3,138 2,393 2,052 1,985 1,176
Household ................................................................ 326
–
–
–
–
Other ........................................................................ 2,812 2,393 2,052 1,985 1,176
Hong Kong ................................................................. 166 247 213 236 163
Rest of Asia-Pacific .................................................... 168 294 195 429 435
North America ............................................................ 4,618 1,624 593 627 550
Household ................................................................ 3,683
–
–
–
–
Other ........................................................................ 935 1,624 593 627 550
South America ............................................................ 601 293 429 550 447
Total ........................................................................... 8,691 4,851 3,482 3,827 2,771
Loans on which interest has been accrued but suspended
Europe ........................................................................ 2,542 2,086 1,553 1,389 1,514
Household ................................................................
–
–
–
–
–
Other ........................................................................ 2,542 2,086 1,553 1,389 1,514
Hong Kong ................................................................. 1,504 1,460 1,795 2,259 2,898
Rest of Asia-Pacific .................................................... 1,351 1,714 2,497 2,627 3,097
North America ............................................................ 33 48 67 39 34
Household ................................................................
–
–
–
–
–
Other ........................................................................ 33 48 67 39 34
South America ............................................................ 95 183 115 160 133
Total ........................................................................... 5,525 5,491 6,027 6,474 7,676
Assets acquired in exchange for advances
Europe ........................................................................ 32 26 84 25 27
Household ................................................................
–
–
–
–
–
Other ........................................................................ 32 26 84 25 27
Hong Kong ................................................................. 217 19 26 72
Rest of Asia-Pacific .................................................... 30 54 32 24 2
North America ............................................................ 794 101 14 19 17
Household ................................................................ 697
–
–
–
–
Other ........................................................................ 97 101 14 19 17
South America ............................................................
–
–
–
–
–
Total ........................................................................... 858 198 149 94 118
Total non-performing loans ........................................ 15,074 10,540 9,658 10,395 10,565
Troubled debt restructurings
Europe ........................................................................ 159 41
–
–
–
Household ................................................................
–
–
–
–
–
Other ........................................................................ 159 41
–
–
–
Hong Kong ................................................................. 571 396 381 395 266
Rest of Asia-Pacific .................................................... 68 89 131 231 138
North America ............................................................ 210 4379
Household ................................................................ 2
–
–
–
–
Other ........................................................................ 208 4379
South America ............................................................ 837 669 144 142 146
Total ........................................................................... 1,845 1,199 659 775 559
Accruing loans contractually past due 90 days or more as to principal or interest
Europe ........................................................................ 34 16 15 11 21
Household ................................................................
–
–
–
–
–
Other ........................................................................ 34 16 15 11 21
Hong Kong ................................................................. 205 193 98 76 84
Rest of Asia-Pacific .................................................... 45 33 38 66 54
North America ............................................................ 1,252 42 52 64 59
Household ................................................................ 1,215
–
–
–
–
Other ........................................................................ 37 42 52 64 59
South America ............................................................ 27478258
Total ........................................................................... 1,538 291 250 299 276
Total risk elements
Europe ........................................................................ 5,905 4,562 3,704 3,410 2,738
Household ................................................................ 326
–
–
–
–
Other ........................................................................ 5,579 4,562 3,704 3,410 2,738
Hong Kong ................................................................. 2,448 2,313 2,506 2,992 3,483
Rest of Asia-Pacific .................................................... 1,662 2,184 2,893 3,377 3,726
North America ............................................................ 6,907 1,819 729 756 669
Household ................................................................ 5,597
–
–
–
–
Other ........................................................................ 1,310 1,819 729 756 669
South America ............................................................ 1,535 1,152 735 934 784
Total ........................................................................... 18,457 12,030 10,567 11,469 11,400
Provisions for bad and doubtful debts as a % of total
risk elements ........................................................ 74.3 76.0 77.4 71.5 70.3