HSBC 2003 Annual Report Download - page 347
Download and view the complete annual report
Please find page 347 of the 2003 HSBC annual report below. You can navigate through the pages in the report by either clicking on the pages listed below, or by using the keyword search tool below to find specific information within the annual report.-
 1
1 -
2
-
3
-
4
-
5
-
6
-
7
-
8
-
9
-
10
-
11
-
12
-
13
-
14
-
15
-
16
-
17
-
18
-
19
-
20
-
21
-
22
-
23
-
24
-
25
-
26
-
27
-
28
-
29
-
30
-
31
-
32
-
33
-
34
-
35
-
36
-
37
-
38
-
39
-
40
-
41
-
42
-
43
-
44
-
45
-
46
-
47
-
48
-
49
-
50
-
51
-
52
-
53
-
54
-
55
-
56
-
57
-
58
-
59
-
60
-
61
-
62
-
63
-
64
-
65
-
66
-
67
-
68
-
69
-
70
-
71
-
72
-
73
-
74
-
75
-
76
-
77
-
78
-
79
-
80
-
81
-
82
-
83
-
84
-
85
-
86
-
87
-
88
-
89
-
90
-
91
-
92
-
93
-
94
-
95
-
96
-
97
-
98
-
99
-
100
-
101
-
102
-
103
-
104
-
105
-
106
-
107
-
108
-
109
-
110
-
111
-
112
-
113
-
114
-
115
-
116
-
117
-
118
-
119
-
120
-
121
-
122
-
123
-
124
-
125
-
126
-
127
-
128
-
129
-
130
-
131
-
132
-
133
-
134
-
135
-
136
-
137
-
138
-
139
-
140
-
141
-
142
-
143
-
144
-
145
-
146
-
147
-
148
-
149
-
150
-
151
-
152
-
153
-
154
-
155
-
156
-
157
-
158
-
159
-
160
-
161
-
162
-
163
-
164
-
165
-
166
-
167
-
168
-
169
-
170
-
171
-
172
-
173
-
174
-
175
-
176
-
177
-
178
-
179
-
180
-
181
-
182
-
183
-
184
-
185
-
186
-
187
-
188
-
189
-
190
-
191
-
192
-
193
-
194
-
195
-
196
-
197
-
198
-
199
-
200
-
201
-
202
-
203
-
204
-
205
-
206
-
207
-
208
-
209
-
210
-
211
-
212
-
213
-
214
-
215
-
216
-
217
-
218
-
219
-
220
-
221
-
222
-
223
-
224
-
225
-
226
-
227
-
228
-
229
-
230
-
231
-
232
-
233
-
234
-
235
-
236
-
237
-
238
-
239
-
240
-
241
-
242
-
243
-
244
-
245
-
246
-
247
-
248
-
249
-
250
-
251
-
252
-
253
-
254
-
255
-
256
-
257
-
258
-
259
-
260
-
261
-
262
-
263
-
264
-
265
-
266
-
267
-
268
-
269
-
270
-
271
-
272
-
273
-
274
-
275
-
276
-
277
-
278
-
279
-
280
-
281
-
282
-
283
-
284
-
285
-
286
-
287
-
288
-
289
-
290
-
291
-
292
-
293
-
294
-
295
-
296
-
297
-
298
-
299
-
300
-
301
-
302
-
303
-
304
-
305
-
306
-
307
-
308
-
309
-
310
-
311
-
312
-
313
-
314
-
315
-
316
-
317
-
318
-
319
-
320
-
321
-
322
-
323
-
324
-
325
-
326
-
327
-
328
-
329
-
330
-
331
-
332
-
333
-
334
-
335
-
336
-
 337
337 -
 338
338 -
 339
339 -
 340
340 -
 341
341 -
 342
342 -
 343
343 -
 344
344 -
 345
345 -
 346
346 -
 347
347 -
 348
348 -
 349
349 -
 350
350 -
 351
351 -
 352
352 -
 353
353 -
 354
354 -
 355
355 -
 356
356 -
 357
357 -
358
-
359
-
360
-
361
-
362
-
363
-
364
-
365
-
366
-
367
-
368
-
369
-
370
-
371
-
372
-
373
-
374
-
375
-
376
-
377
-
378
-
379
-
380
-
381
-
382
-
383
-
384
 |
 |

345
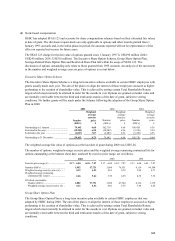
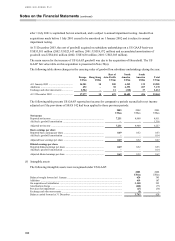
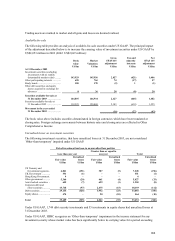
(d) Stock-based compensation
HSBC has adopted SFAS 123 and accounts for share compensation schemes based on their estimated fair values
at date of grant. The disclosure requirements are only applicable to options and other awards granted from 1
January 1995 onwards and, in the initial phase-in period, the amounts reported will not be representative of the
effect on reported net income for future years.
The SFAS 123 charge for the fair value of options granted since 1 January 1997 is US$190 million (2002:
US$240 million; 2001: US$316 million). The Executive Share Option Scheme, Group Share Option Plan,
Savings-Related Share Option Plan and Restricted Share Plan fall within the scope of SFAS 123. The
disclosures of options outstanding only relate to those granted from 1995 onwards. An analysis of the movement
in the number and weighted average exercise price of options is set out below.
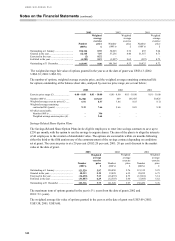
Executive Share Option Scheme
The Executive Share Option Scheme is a long-term incentive scheme available to certain HSBC employees with
grants usually made each year. The aim of the plan is to align the interest of those employees assessed as higher
performing to the creation of shareholder value. This is achieved by setting certain Total Shareholder Return
targets which must normally be attained in order for the awards to vest. Options are granted at market value and
are normally exercisable between the third and tenth anniversaries of the date of grant, subject to vesting
conditions. No further grants will be made under the Scheme following the adoption of the Group Share Option
Plan in 2000.
2003 2002 2001
Number
Weighted
average
exercise
price Number
Weighted
average
exercise
price Number
Weighted
average
exercise
price
(000’s) £ (000’ s) £ (000’ s) £
Outstanding at 1 January ............................ 79,645 6.68 102,710 6.60 109,424 6.56
Exercised in the year .................................. (18,205
)
6.50 (20,982
)
6.26 (3,236
)
5.34
Forfeited in the year ................................... (1,827
)
7.07 (2,083
)
6.91 (3,478
)
6.53
Outstanding at 31 December ...................... 59,613 6.73 79,645 6.68 102,710 6.60
The weighted average fair value of options as at the last date of grant during 2000 was US$5.26.
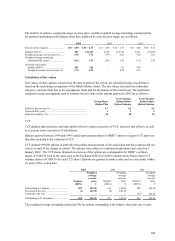
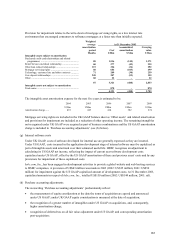
The number of options, weighted average exercise price and the weighted average remaining contractual life for
options outstanding at the balance sheet date, analysed by exercise price range, are as follows:
2003 2002 2001
Exercise price range (£) ......................... 2.17 – 6.00 6.01 – 7.87 2.17 – 6.00 6.01 – 7.87 2.17 – 6.00 6.01 – 7.87
Number (000’s) ...................................... 1,882 57,731 3,094 76,551 4,116 98,594
Weighted average exercise price (£) ...... 4.12 6.81 4.01 6.79 3.94 6.71
Weighted average remaining
contractual life (years) ....................... 2.66 5.61 3.59 6.59 4.55 7.52
Of which exercisable:
Number (000’s) .................................. 1,882 57,731 3,094 47,344 4,116 3,170
Weighted average exercise price (£) .. 4.12 6.81 4.01 6.38 3.94 6.28
Group Share Option Plan
The Group Share Option Plan is a long-term incentive plan available to certain HSBC employees that was
adopted by HSBC during 2000. The aim of the plan is to align the interest of those employees assessed as higher
performing to the creation of shareholder value. This is achieved by setting certain Total Shareholder Return
targets which must normally be attained in order for the awards to vest. Options are granted at market value and
are normally exercisable between the third and tenth anniversaries of the date of grant, subject to vesting
conditions.