HSBC 2003 Annual Report Download - page 146
Download and view the complete annual report
Please find page 146 of the 2003 HSBC annual report below. You can navigate through the pages in the report by either clicking on the pages listed below, or by using the keyword search tool below to find specific information within the annual report.-
 1
1 -
2
-
3
-
4
-
5
-
6
-
7
-
8
-
9
-
10
-
11
-
12
-
13
-
14
-
15
-
16
-
17
-
18
-
19
-
20
-
21
-
22
-
23
-
24
-
25
-
26
-
27
-
28
-
29
-
30
-
31
-
32
-
33
-
34
-
35
-
36
-
37
-
38
-
39
-
40
-
41
-
42
-
43
-
44
-
45
-
46
-
47
-
48
-
49
-
50
-
51
-
52
-
53
-
54
-
55
-
56
-
57
-
58
-
59
-
60
-
61
-
62
-
63
-
64
-
65
-
66
-
67
-
68
-
69
-
70
-
71
-
72
-
73
-
74
-
75
-
76
-
77
-
78
-
79
-
80
-
81
-
82
-
83
-
84
-
85
-
86
-
87
-
88
-
89
-
90
-
91
-
92
-
93
-
94
-
95
-
96
-
97
-
98
-
99
-
100
-
101
-
102
-
103
-
104
-
105
-
106
-
107
-
108
-
109
-
110
-
111
-
112
-
113
-
114
-
115
-
116
-
117
-
118
-
119
-
120
-
121
-
122
-
123
-
124
-
125
-
126
-
127
-
128
-
129
-
130
-
131
-
132
-
133
-
134
-
135
-
 136
136 -
 137
137 -
 138
138 -
 139
139 -
 140
140 -
 141
141 -
 142
142 -
 143
143 -
 144
144 -
 145
145 -
 146
146 -
 147
147 -
 148
148 -
 149
149 -
 150
150 -
 151
151 -
 152
152 -
 153
153 -
 154
154 -
 155
155 -
 156
156 -
157
-
158
-
159
-
160
-
161
-
162
-
163
-
164
-
165
-
166
-
167
-
168
-
169
-
170
-
171
-
172
-
173
-
174
-
175
-
176
-
177
-
178
-
179
-
180
-
181
-
182
-
183
-
184
-
185
-
186
-
187
-
188
-
189
-
190
-
191
-
192
-
193
-
194
-
195
-
196
-
197
-
198
-
199
-
200
-
201
-
202
-
203
-
204
-
205
-
206
-
207
-
208
-
209
-
210
-
211
-
212
-
213
-
214
-
215
-
216
-
217
-
218
-
219
-
220
-
221
-
222
-
223
-
224
-
225
-
226
-
227
-
228
-
229
-
230
-
231
-
232
-
233
-
234
-
235
-
236
-
237
-
238
-
239
-
240
-
241
-
242
-
243
-
244
-
245
-
246
-
247
-
248
-
249
-
250
-
251
-
252
-
253
-
254
-
255
-
256
-
257
-
258
-
259
-
260
-
261
-
262
-
263
-
264
-
265
-
266
-
267
-
268
-
269
-
270
-
271
-
272
-
273
-
274
-
275
-
276
-
277
-
278
-
279
-
280
-
281
-
282
-
283
-
284
-
285
-
286
-
287
-
288
-
289
-
290
-
291
-
292
-
293
-
294
-
295
-
296
-
297
-
298
-
299
-
300
-
301
-
302
-
303
-
304
-
305
-
306
-
307
-
308
-
309
-
310
-
311
-
312
-
313
-
314
-
315
-
316
-
317
-
318
-
319
-
320
-
321
-
322
-
323
-
324
-
325
-
326
-
327
-
328
-
329
-
330
-
331
-
332
-
333
-
334
-
335
-
336
-
337
-
338
-
339
-
340
-
341
-
342
-
343
-
344
-
345
-
346
-
347
-
348
-
349
-
350
-
351
-
352
-
353
-
354
-
355
-
356
-
357
-
358
-
359
-
360
-
361
-
362
-
363
-
364
-
365
-
366
-
367
-
368
-
369
-
370
-
371
-
372
-
373
-
374
-
375
-
376
-
377
-
378
-
379
-
380
-
381
-
382
-
383
-
384
 |
 |

HSBC HOLDINGS PLC
Financial Review (continued)
144
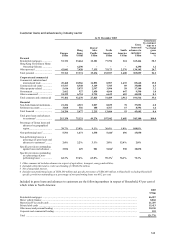
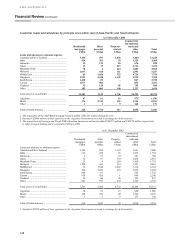
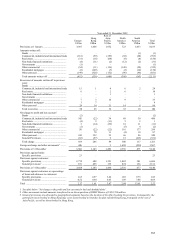
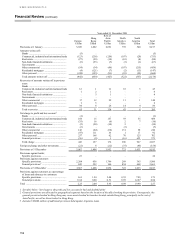
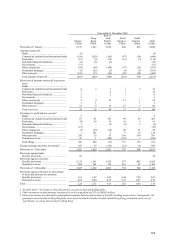
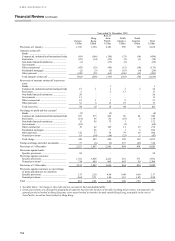
Customer loans and advances by industry sector (continued)
At 31 December 2002
Rest of North South
Gross
loans and
advances to
Gross loans
by customer
type as a
% of total
Europe Hong Kong Asia-Pacific America America customers gross loans
US$m US$m US$m US$m US$m US$m %
Personal
Residential mortgages ................. 38,719 23,839 7,507 26,666 253 96,984 26.9
Hong Kong Government Home
Ownership Scheme .................. –7,255 – – – 7,255 2.0
Other personal ............................. 26,748 7,066 5,900 7,836 1,012 48,562 13.4
Total personal .............................. 65,467 38,160 13,407 34,502 1,265 152,801 42.3
Corporate and commercial
Commercial, industrial and
international trade .................... 44,424 10,173 12,582 10,773 1,063 79,015 21.8
Commercial real estate ................ 11,887 8,336 2,701 6,297 46 29,267 8.1
Other property-related ................. 3,970 4,805 2,031 4,515 26 15,347 4.2
Government ................................. 2,164 719 933 4,575 562 8,953 2.5
Other commercial1 ....................... 22,712 6,612 5,950 4,835 565 40,674 11.2
Total corporate and commercial .. 85,157 30,645 24,197 30,995 2,262 173,256 47.8
Financial
Non-bank financial institutions .... 15,221 2,055 931 9,231 49 27,487 7.6
Settlement accounts ..................... 2,622 347 192 5,224 – 8,385 2.3
Total financial ............................. 17,843 2,402 1,123 14,455 49 35,872 9.9
Total gross loans and advances to
customers2 ............................... 168,467 71,207 38,727 79,952 3,576 361,929 100.0
Percentage of Group loans and
advances by geographical
region....................................... 46.5% 19.7% 10.7% 22.1% 1.0% 100.0%
Non-performing loans3 ................ 4,495 1,724 2,055 1,773 476 10,523
Non-performing loans as a
percentage of gross loans and
advances to customers3 ............ 2.7% 2.4% 5.3% 2.2% 13.3% 2.9%
Specific provisions outstanding
against loans and advances ...... 2,774 688 1,321 1,482 341 6,606
Specific provisions outstanding
as a percentage of non-
performing loans3 .................... 61.7% 39.9% 64.3% 83.6% 71.6% 62.8%
1Other commercial includes advances in respect of agriculture, transport, energy and utilities.
2Included within this total is credit card lending of US$9,950 million.
3Net of suspended interest.