GE 2008 Annual Report Download - page 75
Download and view the complete annual report
Please find page 75 of the 2008 GE annual report below. You can navigate through the pages in the report by either clicking on the pages listed below, or by using the keyword search tool below to find specific information within the annual report.-
 1
1 -
2
-
3
-
4
-
5
-
6
-
7
-
8
-
9
-
10
-
11
-
12
-
13
-
14
-
15
-
16
-
17
-
18
-
19
-
20
-
21
-
22
-
23
-
24
-
25
-
26
-
27
-
28
-
29
-
30
-
31
-
32
-
33
-
34
-
35
-
36
-
37
-
38
-
39
-
40
-
41
-
42
-
43
-
44
-
45
-
46
-
47
-
48
-
49
-
50
-
51
-
52
-
53
-
54
-
55
-
56
-
57
-
58
-
59
-
60
-
61
-
62
-
63
-
64
-
 65
65 -
 66
66 -
 67
67 -
 68
68 -
 69
69 -
 70
70 -
 71
71 -
 72
72 -
 73
73 -
 74
74 -
 75
75 -
 76
76 -
 77
77 -
 78
78 -
 79
79 -
 80
80 -
 81
81 -
 82
82 -
 83
83 -
 84
84 -
 85
85 -
86
-
87
-
88
-
89
-
90
-
91
-
92
-
93
-
94
-
95
-
96
-
97
-
98
-
99
-
100
-
101
-
102
-
103
-
104
-
105
-
106
-
107
-
108
-
109
-
110
-
111
-
112
 |
 |

ge 2008 annual report 73
notes to consolidated financial statements
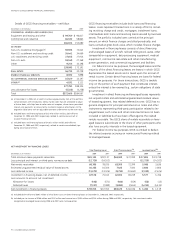
GE receivables balances at December 31, 2008 and 2007, before
allowance for losses, included $11,274 million and $11,008 million,
respectively, from sales of goods and services to customers, and
$293 million and $381 million at December 31, 2008 and 2007,
respectively, from transactions with associated companies.
GE current receivables of $231 million and $252 million at
December 31, 2008 and 2007, respectively, arose from sales, prin-
cipally of Aviation goods and services on open account to various
agencies of the U.S. government, our largest single customer.
About 5% of GE sales of goods and services were to the U.S.
government in 2008, compared with 4% in both 2007 and 2006.
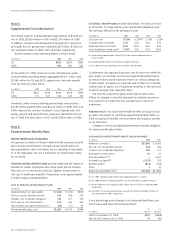
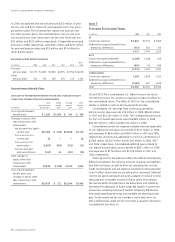
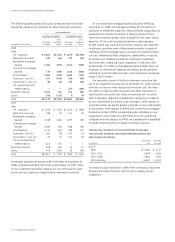
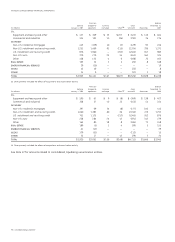
Note 11.
Inventories
December 31 (In millions) 2008 2007
GE
Raw materials and work in process $ 8,710 $ 7,893
Finished goods 5,032 5,025
Unbilled shipments 561 539
14,303 13,457
Less revaluation to LIFO (706) (623)
13,597 12,834
GECS
Finished goods 77 63
Total $13,674 $12,897
Note 12.
GECS Financing Receivables (investments in loans
and financing leases)
December 31 (In millions) 2008 2007
Loans, net of deferred income $310,203 $313,290
Investment in financing leases,
net of deferred income 67,578 75,015
377,781 388,305
Less allowance for losses (Note 13) (5,325) (4,238)
Financing receivables— net $372,456 $384,067
Included in the above are $6,461 million and $9,708 million of the
financing receivables of consolidated, liquidating securitization
entities at December 31, 2008 and 2007, respectively. In addition,
financing receivables at December 31, 2008, included $2,736 mil-
lion relating to loans that had been acquired and accounted for in
accordance with SOP 03-3, Accounting for Certain Loans or Debt
Securities Acquired in a Transfer.
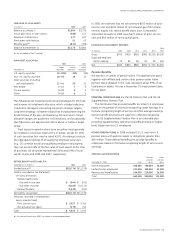
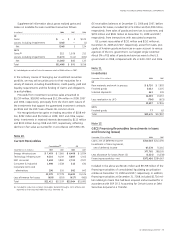
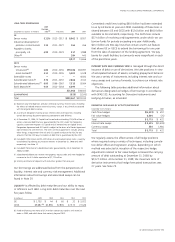
Supplemental information about gross realized gains and
losses on available-for-sale investment securities follows.
(In millions) 2008 2007 2006
GE
Gains $—$ 5 $ 125
Losses, including impairments (148) — (1)
Net (148) 5 124
GECS
Gains (a) 212 1,026 313
Losses, including impairments (1,472) (141) (181)
Net (1,260) 885 132
Total $(1,408) $ 890 $ 256
(a) Included gain on sale of Swiss Re common stock of $566 million in 2007.
In the ordinary course of managing our investment securities
portfolio, we may sell securities prior to their maturities for a
variety of reasons, including diversification, credit quality, yield and
liquidity requirements and the funding of claims and obligations
to policyholders.
Proceeds from investment securities sales amounted to
$5,239 million, $18,993 million and $12,394 million in 2008, 2007
and 2006, respectively, principally from the short-term nature of
the investments that support the guaranteed investment contracts
portfolio and the 2007 sale of Swiss Re common stock.
We recognized pre-tax gains on trading securities of $108 mil-
lion, $292 million and $5 million in 2008, 2007 and 2006, respec-
tively. Investments in retained interests decreased by $113 million
and $102 million during 2008 and 2007, respectively, reflecting
declines in fair value accounted for in accordance with SFAS 155.
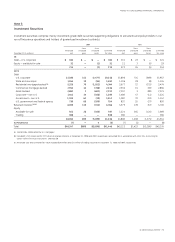
Note 10.
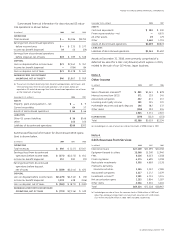
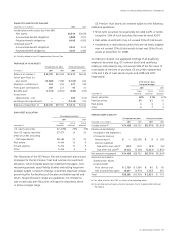
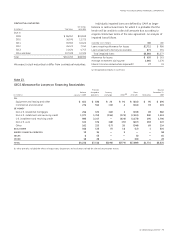
Current Receivables
Consolidated (a) GE
December 31 (In millions) 2008 2007 2008 2007
Energy Infrastructure $ 7,403 $ 7,065 $ 6,409 $ 5,934
Technology Infrastructure 9,214 9,149 5,687 5,443
NBC Universal 3,659 3,800 2,701 2,927
Consumer & Industrial 1,498 2,238 513 630
Corporate items and
eliminations 296 526 381 642
22,070 22,778 15,691 15,576
Less allowance for losses (659) (519) (627) (483)
Total $21,411 $22,259 $15,064 $15,093
(a) Included GE industrial customer receivables factored through a GECS affiliate and
reported as financing receivables by GECS. See Note 26.