GE 2008 Annual Report Download - page 37
Download and view the complete annual report
Please find page 37 of the 2008 GE annual report below. You can navigate through the pages in the report by either clicking on the pages listed below, or by using the keyword search tool below to find specific information within the annual report.-
 1
1 -
2
-
3
-
4
-
5
-
6
-
7
-
8
-
9
-
10
-
11
-
12
-
13
-
14
-
15
-
16
-
17
-
18
-
19
-
20
-
21
-
22
-
23
-
24
-
25
-
26
-
 27
27 -
 28
28 -
 29
29 -
 30
30 -
 31
31 -
 32
32 -
 33
33 -
 34
34 -
 35
35 -
 36
36 -
 37
37 -
 38
38 -
 39
39 -
 40
40 -
 41
41 -
 42
42 -
 43
43 -
 44
44 -
 45
45 -
 46
46 -
 47
47 -
48
-
49
-
50
-
51
-
52
-
53
-
54
-
55
-
56
-
57
-
58
-
59
-
60
-
61
-
62
-
63
-
64
-
65
-
66
-
67
-
68
-
69
-
70
-
71
-
72
-
73
-
74
-
75
-
76
-
77
-
78
-
79
-
80
-
81
-
82
-
83
-
84
-
85
-
86
-
87
-
88
-
89
-
90
-
91
-
92
-
93
-
94
-
95
-
96
-
97
-
98
-
99
-
100
-
101
-
102
-
103
-
104
-
105
-
106
-
107
-
108
-
109
-
110
-
111
-
112
 |
 |

management’s discussion and analsis
ge 2008 annual report 35
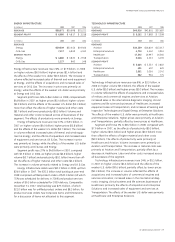
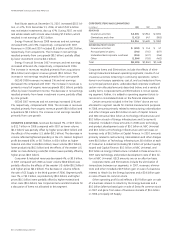
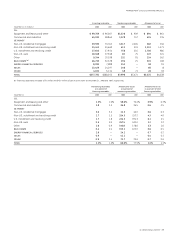
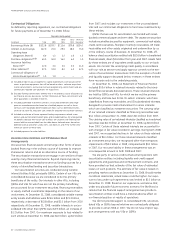
Financing receivables Nonearning receivables Allowance for losses
December 31 (In millions) 2008 2007 2008 2007 2008 2007
CLL
Equipment and leasing and other $ 99,769 $ 96,817 $1,526 $ 939 $ 894 $ 661
Commercial and industrial 64,332 58,863 1,128 757 415 276
GE MONEY
Non-U.S. residential mortgages 59,595 73,042 3,317 2,465 382 246
Non-U.S. installment and revolving credit 24,441 34,669 413 533 1,051 1,371
U.S. installment and revolving credit 27,645 27,914 758 515 1,700 985
Non-U.S. auto 18,168 27,368 83 75 222 324
Other 9,244 10,198 152 91 214 162
REAL ESTATE (a) 46,735 32,228 194 25 301 168
ENERGY FINANCIAL SERVICES 8,392 7,898 241 —58 19
GECAS 15,429 14,197 146 —60 8
OTHER 4,031 5,111 38 71 28 18
TOTAL $377,781 $388,305 $7,996 $5,471 $5,325 $4,238
(a) Financing receivables included $731 million and $452 million of construction loans at December 31, 2008 and 2007, respectively.
Nonearning receivables Allowance for losses Allowance for losses
as a percent of as a percent of as a percent of total
financing receivables nonearning receivables financing receivables
December 31 2008 2007 2008 2007 2008 2007
CLL
Equipment and leasing and other 1.5% 1.0% 58.6% 70.4% 0.9% 0.7%
Commercial and industrial 1.8 1.3 36.8 36.5 0.6 0.5
GE MONEY
Non-U.S. residential mortgages 5.6 3.4 11.5 10.0 0.6 0.3
Non-U.S. installment and revolving credit 1.7 1.5 254.5 257.2 4.3 4.0
U.S. installment and revolving credit 2.7 1.8 224.3 191.3 6.1 3.5
Non-U.S. auto 0.5 0.3 267.5 432.0 1.2 1.2
Other 1.6 0.9 140.8 178.0 2.3 1.6
REAL ESTATE 0.4 0.1 155.2 672.0 0.6 0.5
ENERGY FINANCIAL SERVICES 2.9 —24.1 —0.7 0.2
GECAS 0.9 —41.1 —0.4 0.1
OTHER 0.9 1.4 73.7 25.4 0.7 0.4
TOTAL 2.1% 1.4% 66.6% 77.5% 1.4% 1.1%