GE 2008 Annual Report Download - page 104
Download and view the complete annual report
Please find page 104 of the 2008 GE annual report below. You can navigate through the pages in the report by either clicking on the pages listed below, or by using the keyword search tool below to find specific information within the annual report.-
 1
1 -
2
-
3
-
4
-
5
-
6
-
7
-
8
-
9
-
10
-
11
-
12
-
13
-
14
-
15
-
16
-
17
-
18
-
19
-
20
-
21
-
22
-
23
-
24
-
25
-
26
-
27
-
28
-
29
-
30
-
31
-
32
-
33
-
34
-
35
-
36
-
37
-
38
-
39
-
40
-
41
-
42
-
43
-
44
-
45
-
46
-
47
-
48
-
49
-
50
-
51
-
52
-
53
-
54
-
55
-
56
-
57
-
58
-
59
-
60
-
61
-
62
-
63
-
64
-
65
-
66
-
67
-
68
-
69
-
70
-
71
-
72
-
73
-
74
-
75
-
76
-
77
-
78
-
79
-
80
-
81
-
82
-
83
-
84
-
85
-
86
-
87
-
88
-
89
-
90
-
91
-
92
-
93
-
 94
94 -
 95
95 -
 96
96 -
 97
97 -
 98
98 -
 99
99 -
 100
100 -
 101
101 -
 102
102 -
 103
103 -
 104
104 -
 105
105 -
 106
106 -
 107
107 -
 108
108 -
 109
109 -
 110
110 -
 111
111 -
 112
112
 |
 |

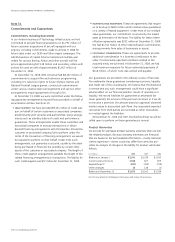
102 ge 2008 annual report
supplemental information
Financial Measures that Supplement Generally
Accepted Accounting Principles
We sometimes use information derived from consolidated financial
information but not presented in our financial statements prepared
in accordance with U.S. generally accepted accounting principles
(GAAP). Certain of these data are considered “non-GAAP financial
measures” under U.S. Securities and Exchange Commission rules.
Specifically, we have referred, in various sections of this Annual
Report, to:
Þ Industrial organic revenue growth in 2008
Þ Average organic revenue growth for the three years ended
December 31, 2008
Þ Average total shareowners’ equity, excluding effects of
discontinued operations
Þ Cash generated by our industrial businesses
Þ Ratio of debt to equity at GE Capital, net of cash and equiva-
lents and with classification of hybrid debt as equity
Þ GE pre-tax earnings from continuing operations before income
taxes, excluding GECS earnings from continuing operations,
the corresponding effective tax rates and the reconciliation of
the U.S. federal statutory rate to those effective tax rates for
the three years ended December 31, 2008
Þ Delinquency rates on managed equipment financing loans
and leases and managed consumer financing receivables for
2008, 2007 and 2006
The reasons we use these non-GAAP financial measures and the reconciliations to their most directly comparable GAAP financial mea-
sures follow.
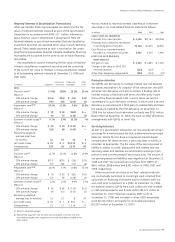
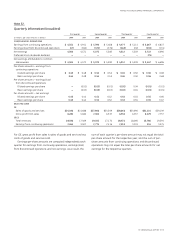
Industrial Organic Revenue Growth in 2008
(In millions) 2008 2007 % change
GE revenues as reported $121,753 $115,584
Less GECS earnings from continuing operations 7,774 12,417
Industrial revenues 113,979 103,167
Less the effects of
Acquisitions, business dispositions (other than dispositions of businesses acquired for investment)
and currency exchange rates 4,054 2,031
The 2008 Olympics broadcasts 1,020 —
Industrial revenues excluding the effects of acquisitions, business dispositions (other than dispositions
of businesses acquired for investment), currency exchange rates and the 2008 Olympics broadcasts
(Industrial organic revenues) $108,905 $101,136 8%
Organic Revenue Growth in 2008
(In millions) 2008 2007 % change
GE consolidated revenues as reported $182,515 $172,488
Less the effects of
Acquisitions, business dispositions (other than dispositions of businesses acquired for investment)
and currency exchange rates 10,139 2,992
The 2008 Olympics broadcasts 1,020 —
GE consolidated revenues excluding the effects of acquisitions, business dispositions (other than dispositions
of businesses acquired for investment), currency exchange rates and the 2008 Olympics broadcasts
(organic revenues) $171,356 $169,496 1%
Organic Revenue Growth in 2007
(In millions) 2007 2006 % change
GE consolidated revenues as reported $172,488 $151,568
Less the effects of
Acquisitions, business dispositions (other than dispositions of businesses acquired for investment) and
currency exchange rates 12,803 4,992
The 2006 Olympics broadcasts — 684
Reclassification of discontinued operations (250) (275)
GE consolidated revenues excluding the effects of acquisitions, business dispositions (other than dispositions
of businesses acquired for investment), currency exchange rates, the 2006 Olympics broadcasts and
reclassifications of discontinued operations (organic revenues) $159,935 $146,167 9%