GE 2008 Annual Report Download - page 30
Download and view the complete annual report
Please find page 30 of the 2008 GE annual report below. You can navigate through the pages in the report by either clicking on the pages listed below, or by using the keyword search tool below to find specific information within the annual report.-
 1
1 -
2
-
3
-
4
-
5
-
6
-
7
-
8
-
9
-
10
-
11
-
12
-
13
-
14
-
15
-
16
-
17
-
18
-
19
-
 20
20 -
 21
21 -
 22
22 -
 23
23 -
 24
24 -
 25
25 -
 26
26 -
 27
27 -
 28
28 -
 29
29 -
 30
30 -
 31
31 -
 32
32 -
 33
33 -
 34
34 -
 35
35 -
 36
36 -
 37
37 -
 38
38 -
 39
39 -
 40
40 -
41
-
42
-
43
-
44
-
45
-
46
-
47
-
48
-
49
-
50
-
51
-
52
-
53
-
54
-
55
-
56
-
57
-
58
-
59
-
60
-
61
-
62
-
63
-
64
-
65
-
66
-
67
-
68
-
69
-
70
-
71
-
72
-
73
-
74
-
75
-
76
-
77
-
78
-
79
-
80
-
81
-
82
-
83
-
84
-
85
-
86
-
87
-
88
-
89
-
90
-
91
-
92
-
93
-
94
-
95
-
96
-
97
-
98
-
99
-
100
-
101
-
102
-
103
-
104
-
105
-
106
-
107
-
108
-
109
-
110
-
111
-
112
 |
 |

management’s discussion and analsis
28 ge 2008 annual report
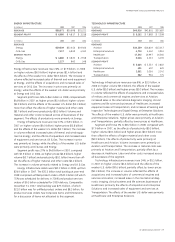
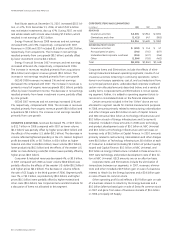
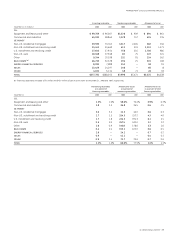
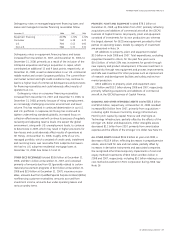
CAPITAL FINANCE
(In millions) 2008 2007 2006
REVENUES $67,008 $66,301 $56,378
SEGMENT PROFIT $ 8,632 $12,243 $10,397
December 31 (In millions) 2008 2007
TOTAL ASSETS $572,903 $583,965
(In millions) 2008 2007 2006
REVENUES
Commercial Lending and
Leasing (CLL) $26,742 $27,267 $25,833
GE Money 25,012 24,769 19,508
Real Estate 6,646 7,021 5,020
Energy Financial Services 3,707 2,405 1,664
GE Commercial Aviation
Services (GECAS) 4,901 4,839 4,353
SEGMENT PROFIT
CLL $ 1,805 $ 3,801 $ 3,503
GE Money 3,664 4,269 3,231
Real Estate 1,144 2,285 1,841
Energy Financial Services 825 677 648
GECAS 1,194 1,211 1,174
December 31 (In millions) 2008 2007
TOTAL ASSETS
CLL $232,486 $229,608
GE Money 183,617 209,178
Real Estate 85,266 79,285
Energy Financial Services 22,079 18,705
GECAS 49,455 47,189
Capital Finance 2008 revenues increased by 1%, and net earnings
decreased 29%, compared with 2007. Revenues in 2008 and
2007 included $4.4 billion and $0.5 billion from acquisitions,
respectively, and in 2008 were benefited by $0.1 billion as a result
of dispositions. Revenues in 2008 also decreased $3.3 billion as a
result of organic revenue declines ($4.5 billion), partially offset by
the weaker U.S. dollar ($1.2 billion). Net earnings decreased by
$3.6 billion in 2008, resulting from core declines ($3.5 billion),
including an increase of $1.9 billion in the provision for losses on
financing receivables, lower investment income ($0.6 billion) and
lower securitization income ($0.4 billion), offset by acquisitions
($0.5 billion), the weaker U.S. dollar ($0.3 billion) and dispositions
($0.1 billion). Net earnings included mark-to-market losses and
impairments ($1.4 billion), partially offset by increased tax benefits
from lower-taxed earnings from global operations ($0.7 billion)
and Genpact mark-to-market gains ($0.2 billion).
Segment profit rose 8% to $7.9 billion in 2007, compared with
$7.3 billion in 2006, as higher volume ($0.8 billion), productivity
($0.4 billion) and higher sales of minority interests in engine
programs ($0.1 billion) more than offset the effects of higher
material and other costs ($0.7 billion) and lower prices ($0.1 billion).
The increase in volume primarily related to Aviation, Healthcare
and Enterprise Solutions. The effects of productivity were primarily
at Healthcare and Transportation. The increase in material costs
was primarily at Aviation, partially offset by a decrease at
Healthcare, and labor and other costs increased across all busi-
nesses of the segment.
Technology Infrastructure orders were $47.2 billion in 2008,
down from $48.7 billion in 2007. The $37.6 billion total backlog at
year-end 2008 comprised unfilled product orders of $28.4 billion
(of which 48% was scheduled for delivery in 2009) and product
services orders of $9.2 billion scheduled for 2009 delivery.
Comparable December 31, 2007, total backlog was $35.5 billion,
of which $27.5 billion was for unfilled product orders and
$8.0 billion, for product services orders. See Corporate Items
and Eliminations for a discussion of items not allocated to this
segment.
NBC UNIVERSAL revenues increased $1.6 billion, or 10%, to
$17.0 billion in 2008, as revenues from the Olympics broadcasts
($1.0 billion) and higher revenues in cable ($0.6 billion) and film
($0.4 billion) were partially offset by lower earnings and impair-
ments related to associated companies and investment securities
($0.3 billion) and lower revenues from our television business
($0.1 billion). Segment profit of $3.1 billion in 2008 was flat com-
pared with 2007, as higher earnings from cable ($0.3 billion) and
proceeds from insurance claims ($0.4 billion) were offset by lower
earnings and impairments related to associated companies and
investment securities ($0.3 billion), losses from the Olympics
broadcasts ($0.2 billion), and lower earnings from our television
business ($0.1 billion) and film ($0.1 billion).
NBC Universal revenues declined 5%, or $0.8 billion, in 2007,
primarily from the lack of current-year counterparts to the 2006
Olympics broadcasts ($0.7 billion) and 2006 sale of television
stations ($0.2 billion), lower revenues in our broadcast network
and television stations as a result of lower advertising sales
($0.5 billion) and lower film revenues ($0.1 billion), partially offset
by higher revenues for cable ($0.4 billion) and television produc-
tion and distribution ($0.3 billion). Segment profit rose 6%, or
$0.2 billion, in 2007 as improvements in cable ($0.2 billion), tele-
vision production and distribution ($0.2 billion), film ($0.1 billion)
and the absence of Olympics broadcasts in 2007 ($0.1 billion)
were partially offset by the lack of a current-year counterpart to
the 2006 sale of four television stations ($0.2 billion) and lower
earnings from our broadcast network and television stations
($0.2 billion). See Corporate Items and Eliminations for a discussion
of items not allocated to this segment.