GE 2008 Annual Report Download - page 66
Download and view the complete annual report
Please find page 66 of the 2008 GE annual report below. You can navigate through the pages in the report by either clicking on the pages listed below, or by using the keyword search tool below to find specific information within the annual report.-
 1
1 -
2
-
3
-
4
-
5
-
6
-
7
-
8
-
9
-
10
-
11
-
12
-
13
-
14
-
15
-
16
-
17
-
18
-
19
-
20
-
21
-
22
-
23
-
24
-
25
-
26
-
27
-
28
-
29
-
30
-
31
-
32
-
33
-
34
-
35
-
36
-
37
-
38
-
39
-
40
-
41
-
42
-
43
-
44
-
45
-
46
-
47
-
48
-
49
-
50
-
51
-
52
-
53
-
54
-
55
-
 56
56 -
 57
57 -
 58
58 -
 59
59 -
 60
60 -
 61
61 -
 62
62 -
 63
63 -
 64
64 -
 65
65 -
 66
66 -
 67
67 -
 68
68 -
 69
69 -
 70
70 -
 71
71 -
 72
72 -
 73
73 -
 74
74 -
 75
75 -
 76
76 -
77
-
78
-
79
-
80
-
81
-
82
-
83
-
84
-
85
-
86
-
87
-
88
-
89
-
90
-
91
-
92
-
93
-
94
-
95
-
96
-
97
-
98
-
99
-
100
-
101
-
102
-
103
-
104
-
105
-
106
-
107
-
108
-
109
-
110
-
111
-
112
 |
 |

64 ge 2008 annual report
notes to consolidated financial statements
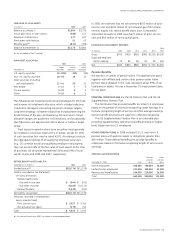
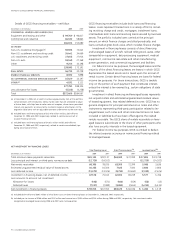
ACTUARIAL ASSUMPTIONS are described below. The discount rates
at December 31 measured the year-end benefit obligations and
the earnings effects for the subsequent year.
December 31 2008 2007 2006 2005
Discount rate 6.15% 6.31% (a) 5.75% 5.25%
Compensation increases 4.20 5.00 5.00 5.00
Expected return on assets 8.50 8.50 8.50 8.50
Initial healthcare trend rate(c) 7.00 (b) 9.10 9.20 10.00
(a) Weighted average discount rate of 6.34% was used for determination of
costs in 2008.
(b) Includes benefits from new healthcare supplier contracts.
(c) For 2008, ultimately declining to 6% for 2025 and thereafter.
To determine the expected long-term rate of return on retiree life
plan assets, we consider current and expected asset allocations,
as well as historical and expected returns on various categories
of plan assets. We apply our expected rate of return to a market-
related value of assets, which stabilizes variability in the amounts
to which we apply that expected return.
We amortize experience gains and losses as well as the
effects of changes in actuarial assumptions and plan provisions
over a period no longer than the average future service of
employees.
FUNDING POLICY. We fund retiree health benefits on a pay-as-you-
go basis. We expect to contribute approximately $665 million in
2009 to fund such benefits. We fund retiree life insurance benefits
at our discretion.
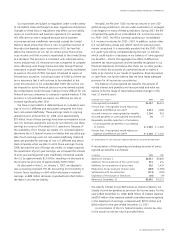
Changes in the accumulated postretirement benefit obligation
for retiree benefit plans follow.
ACCUMULATED POSTRETIREMENT BENEFIT OBLIGATION (APBO)
(In millions) 2008 2007
Balance at January 1 $12,983 $ 8,262
Service cost for benefits earned 326 286
Interest cost on benefit obligation 750 577
Participant contributions 51 47
Plan amendments (a) —4,257
Actuarial loss (gain) (b) (1,351) 320
Benefits paid (c) (811) (796)
Other 130
Balance at December 31 (d) $11,949 $12,983
(a) For 2007, related to labor agreements negotiated with U.S. unions.
(b) For 2008, primarily related to benefits from new healthcare supplier contracts.
(c) Net of Medicare Part D subsidy of $83 million and $73 million in 2008 and 2007,
respectively.
(d) The APBO for the retiree health plans was $9,749 million and $10,847 million at
year-end 2008 and 2007, respectively.
A one percentage point change in the assumed healthcare cost
trend rate would have the following effects.
1% 1%
(In millions) increase decrease
APBO at December 31, 2008 $990 $(848)
Service and interest cost in 2008 95 (80)
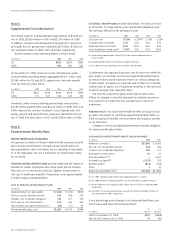
Note 5.
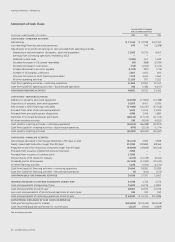
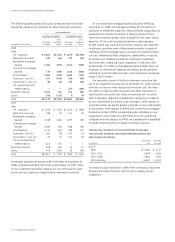
Supplemental Cost Information
We funded research and development expenditures of $3,020 mil-
lion in 2008, $3,009 million in 2007 and $2,790 million in 2006.
In addition, research and development funding from customers,
principally the U.S. government, totaled $1,287 million, $1,066 mil-
lion and $690 million in 2008, 2007 and 2006, respectively.
Rental expense under operating leases is shown below.
(In millions) 2008 2007 2006
GE $912 $929 $854
GECS 992 955 863
At December 31, 2008, minimum rental commitments under
noncancellable operating leases aggregated $3,022 million and
$3,565 million for GE and GECS, respectively. Amounts payable
over the next five years follow.
(In millions) 2009 2010 2011 2012 2013
GE $550 $548 $496 $429 $390
GECS 774 621 508 435 303
Payments under revenue sharing partnerships amounted to
$2,290 million, $1,878 million and $1,413 million in 2008, 2007 and
2006, respectively, and are included in cost of goods sold. GE’s
selling, general and administrative expenses totaled $14,401 mil-
lion in 2008, $14,148 million in 2007 and $12,893 million in 2006.
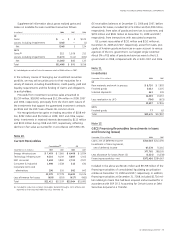
Note 6.
Postretirement Benefit Plans
Retiree Health and Life Benefits
We sponsor a number of retiree health and life insurance benefit
plans (retiree benefit plans). Principal retiree benefit plans are
discussed below; other such plans are not significant individually
or in the aggregate. We use a December 31 measurement date
for our plans.
PRINCIPAL RETIREE BENEFIT PLANS provide health and life insurance
benefits to certain employees who retire under the GE Pension
Plan with 10 or more years of service. Eligible retirees share in
the cost of healthcare benefits. These plans cover approximately
225,000 retirees and dependents.
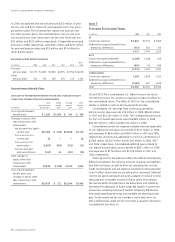
COST OF PRINCIPAL RETIREE BENEFIT PLANS
(In millions) 2008 2007 2006
Expected return on plan assets $ (131) $ (125) $(127)
Service cost for benefits earned 326 286 229
Interest cost on benefit obligation 750 577 455
Prior service cost amortization 673 603 363
Net actuarial loss (gain) amortization (49) (17) 64
Retiree benefit plans cost $1,569 $1,324 $ 984