GE 2008 Annual Report Download - page 36
Download and view the complete annual report
Please find page 36 of the 2008 GE annual report below. You can navigate through the pages in the report by either clicking on the pages listed below, or by using the keyword search tool below to find specific information within the annual report.-
 1
1 -
2
-
3
-
4
-
5
-
6
-
7
-
8
-
9
-
10
-
11
-
12
-
13
-
14
-
15
-
16
-
17
-
18
-
19
-
20
-
21
-
22
-
23
-
24
-
25
-
 26
26 -
 27
27 -
 28
28 -
 29
29 -
 30
30 -
 31
31 -
 32
32 -
 33
33 -
 34
34 -
 35
35 -
 36
36 -
 37
37 -
 38
38 -
 39
39 -
 40
40 -
 41
41 -
 42
42 -
 43
43 -
 44
44 -
 45
45 -
 46
46 -
47
-
48
-
49
-
50
-
51
-
52
-
53
-
54
-
55
-
56
-
57
-
58
-
59
-
60
-
61
-
62
-
63
-
64
-
65
-
66
-
67
-
68
-
69
-
70
-
71
-
72
-
73
-
74
-
75
-
76
-
77
-
78
-
79
-
80
-
81
-
82
-
83
-
84
-
85
-
86
-
87
-
88
-
89
-
90
-
91
-
92
-
93
-
94
-
95
-
96
-
97
-
98
-
99
-
100
-
101
-
102
-
103
-
104
-
105
-
106
-
107
-
108
-
109
-
110
-
111
-
112
 |
 |
management’s discussion and analsis
34 ge 2008 annual report
FINANCING RECEIVABLES is our largest category of assets and
represents one of our primary sources of revenues. A discussion
of the quality of certain elements of the financing receivables
portfolio follows. For purposes of that discussion, “delinquent”
receivables are those that are 30 days or more past due; and
“nonearning” receivables are those that are 90 days or more past
due (or for which collection has otherwise become doubtful).
Our portfolio of financing receivables is diverse and not
directly comparable to major U.S. banks. Historically, we have
had less consumer exposure, which over time has had higher
loss rates than commercial exposure. Our consumer exposure is
largely non-U.S. and primarily comprises mortgage, sales finance,
auto and personal loans in various European and Asian countries.
Our U.S. consumer financing receivables comprise 7% of our
total portfolio. Of those, approximately 42% relate primarily to
credit cards, which are often subject to profit and loss sharing
arrangements with the retailer (the results of which are reflected
in GECS revenues), and have a smaller average balance and lower
loss severity as compared to bank cards. The remaining 58% are
sales finance receivables, which provide electronics, recreation,
medical and home improvement financing to customers. In 2007,
we exited the U.S. mortgage business and we have no U.S. auto
or student loans.
Our commercial portfolio primarily comprises senior, secured
positions with comparatively low loss history. The secured
receivables in this portfolio are collateralized by a variety of asset
classes, including industrial-related facilities and equipment;
commercial and residential real estate; vehicles, aircraft, and
equipment used in many industries, including the construction,
manufacturing, transportation, telecommunications and health-
care industries. In addition, 2% of this portfolio is unsecured
corporate debt.
Losses on financing receivables are recognized when they
are incurred, which requires us to make our best estimate of
probable losses inherent in the portfolio. Such estimate requires
consideration of historical loss experience, adjusted for current
conditions, and judgments about the probable effects of relevant
observable data, including present economic conditions such
as delinquency rates, financial health of specific customers and
market sectors, collateral values, and the present and expected
future levels of interest rates. Our risk management process
includes standards and policies for reviewing major risk expo-
sures and concentrations, and evaluates relevant data either for
individual loans or financing leases, or on a portfolio basis, as
appropriate.
in an unrealized loss position at December 31, 2008, we intend
to hold them at least until such time as their individual fair values
exceed their amortized cost and we have the ability to hold all
such debt securities until their maturities. The fair values used to
determine these unrealized gains and losses are those defined
by relevant accounting standards and are not a forecast of
future gains or losses. For additional information, see Note 9.
FAIR VALUE MEASUREMENTS. Effective January 1, 2008, we
adopted Financial Accounting Standards Board (FASB) Statement
of Financial Accounting Standards (SFAS) 157, Fair Value
Measurements, for all financial instruments and non-financial
instruments accounted for at fair value on a recurring basis.
Adoption of SFAS 157 did not have a material effect on our
financial position or results of operations. During the fourth
quarter, our methodology remained consistent with prior quarters
for measuring fair value of financial instruments trading in
volatile markets. Additional information about our application of
SFAS 157 is provided in Note 28.
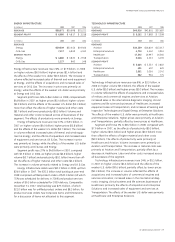
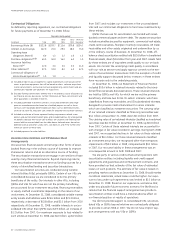
WORKING CAPITAL, representing GE current receivables and
inventories, less GE accounts payable and progress collections,
was $3.9 billion at December 31, 2008, down $2.5 billion from
December 31, 2007, reflecting higher progress collections at
Energy. As Energy delivers units out of its backlog over the next
few years, progress collections of $13.1 billion at December 31,
2008, will be earned, affecting working capital adversely.
Nonetheless, our performance is expected to improve in 2009 as
a result of our Operating Council’s initiatives (e.g., lean projects
on cycle time), which will significantly offset the decrease in
progress collections.
We discuss current receivables and inventories, two important
elements of working capital, in the following paragraphs.
CURRENT RECEIVABLES for GE amounted to $15.1 billion at both
the end of 2008 and 2007, and included $11.3 billion due from
customers at the end of 2008 compared with $11.0 billion at the
end of 2007. GE current receivables turnover was 7.5 in 2008,
compared with 7.3 in 2007. See Note 10.
INVENTORIES for GE amounted to $13.6 billion at December 31,
2008, up $0.8 billion from the end of 2007. This increase reflected
higher inventories from purchases at Energy Infrastructure. GE
inventory turnover was 8.0 and 8.3 in 2008 and 2007, respectively.
See Note 11.