GE 2008 Annual Report Download - page 38
Download and view the complete annual report
Please find page 38 of the 2008 GE annual report below. You can navigate through the pages in the report by either clicking on the pages listed below, or by using the keyword search tool below to find specific information within the annual report.-
 1
1 -
2
-
3
-
4
-
5
-
6
-
7
-
8
-
9
-
10
-
11
-
12
-
13
-
14
-
15
-
16
-
17
-
18
-
19
-
20
-
21
-
22
-
23
-
24
-
25
-
26
-
27
-
 28
28 -
 29
29 -
 30
30 -
 31
31 -
 32
32 -
 33
33 -
 34
34 -
 35
35 -
 36
36 -
 37
37 -
 38
38 -
 39
39 -
 40
40 -
 41
41 -
 42
42 -
 43
43 -
 44
44 -
 45
45 -
 46
46 -
 47
47 -
 48
48 -
49
-
50
-
51
-
52
-
53
-
54
-
55
-
56
-
57
-
58
-
59
-
60
-
61
-
62
-
63
-
64
-
65
-
66
-
67
-
68
-
69
-
70
-
71
-
72
-
73
-
74
-
75
-
76
-
77
-
78
-
79
-
80
-
81
-
82
-
83
-
84
-
85
-
86
-
87
-
88
-
89
-
90
-
91
-
92
-
93
-
94
-
95
-
96
-
97
-
98
-
99
-
100
-
101
-
102
-
103
-
104
-
105
-
106
-
107
-
108
-
109
-
110
-
111
-
112
 |
 |

management’s discussion and analsis
36 ge 2008 annual report
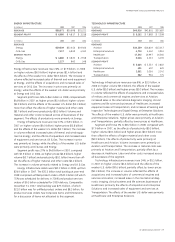
CLL— EQUIPMENT AND LEASING AND OTHER. Nonearning receivables
of $1.5 billion represented 19.1% of total nonearning receivables
at December 31, 2008. The ratio of allowance for losses as a
percent of nonearning receivables declined from 70.4% at
December 31, 2007, to 58.6% at December 31, 2008, primarily
from an increase in secured exposures which did not require
specific reserves based upon the strength of the underlying
collateral values.
CLL — COMMERCIAL AND INDUSTRIAL. Nonearning receivables of
$1.1 billion represented 14.1% of total nonearning receivables at
December 31, 2008. The ratio of allowance for losses as a percent
of nonearning receivables increased from 36.5% at December 31,
2007, to 36.8% at December 31, 2008. The ratio of nonearning
receivables as a percentage of financing receivables increased
from 1.3% at December 31, 2007, to 1.8% at December 31,
2008, primarily from an increase in nonearning receivables in
secured lending in media and communications, auto and trans-
portation, and consumer manufacturing companies.
GE MONEY — NON-U.S. RESIDENTIAL MORTGAGES. Nonearning
receivables of $3.3 billion represented 41.5% of total nonearning
receivables at December 31, 2008. The ratio of allowance for
losses as a percent of nonearning receivables increased from
10.0% at December 31, 2007, to 11.5% at December 31, 2008.
Our non-U.S. mortgage portfolio has a loan-to-value of approxi-
mately 74% at origination and the vast majority are first lien
positions. In addition, we carry mortgage insurance on most first
mortgage loans originated at a loan-to-value above 80%. In 2008,
our nonearning receivables increased primarily as a result of
the declining U.K. housing market and our allowance increased
accordingly. At December 31, 2008, we had foreclosed on fewer
than 1,000 houses in the U.K.
GE MONEY — U.S. INSTALLMENT AND REVOLVING CREDIT.
Nonearning receivables of $0.8 billion represented 9.5% of total
nonearning receivables at December 31, 2008. The ratio of allow-
ance for losses as a percent of nonearning receivables increased
from 191.3% at December 31, 2007, to 224.3% at December 31,
2008, reflecting the effects of the continued deterioration in our
U.S. portfolio in connection with rising unemployment.
GE MONEY — NON-U.S. AUTO. Nonearning receivables of $0.1 billion
represented 1% of total nonearning receivables at December 31,
2008. The ratio of allowance for losses as a percent of nonearning
receivables decreased from 432.0% at December 31, 2007, to
267.5% at December 31, 2008. This is primarily a result of the
disposition of our Thailand auto business, the decision to dispose
of our U.K. auto business, and the effects of recoveries.
The majority of the allowance for losses of $5.3 billion at
December 31, 2008, and $4.2 billion at December 31, 2007, is
determined based upon a formulaic approach. Further information
on the determination of the allowance for losses on financing
receivables is provided in the Critical Accounting Estimates section
and Notes 1 and 13.
A portion of the allowance for losses is related to specific
reserves on loans that have been determined to be individually
impaired under SFAS 114, Accounting by Creditors for Impairment
of a Loan. Under SFAS 114, individually impaired loans are defined
as larger balance or restructured loans for which it is probable that
the lender will be unable to collect all amounts due according to
original contractual terms of the loan agreement. These specific
reserves amounted to $0.6 billion and $0.4 billion at December 31,
2008 and December 31, 2007, respectively. Further information
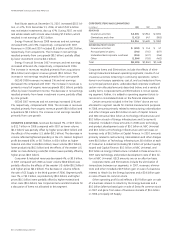
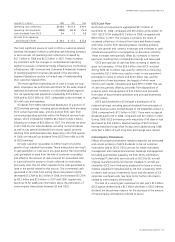
pertaining to specific reserves is included in the table below.
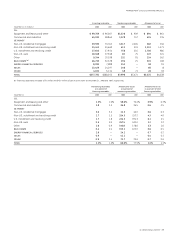
December 31 (In millions) 2008 2007
Loans requiring allowance for losses $2,712 $ 986
Loans expected to be fully recoverable 871 391
Total impaired loans $3,583 $1,377
Allowance for losses $ 635 $ 361
Average investment during year 2,064 1,576
Interest income earned while impaired(a) 27 19
(a) Recognized principally on cash basis.
The portfolio of financing receivables, before allowance for losses,
was $377.8 billion at December 31, 2008, and $388.3 billion at
December 31, 2007. Financing receivables, before allowance for
losses, decreased $10.5 billion from December 31, 2007, primarily
as a result of commercial and equipment securitization and sales
($36.7 billion), the stronger U.S. dollar ($29.4 billion) and dispositions
($7.0 billion), partially offset by core growth ($42.9 billion) and
acquisitions ($31.9 billion).
Related nonearning receivables totaled $8.0 billion (2.1% of
outstanding receivables) at December 31, 2008, compared with
$5.5 billion (1.4% of outstanding receivables) at December 31, 2007.
Related nonearning receivables increased from December 31,
2007, primarily because of rising unemployment, along with the
increasingly challenging global economic environment.
The allowance for losses at December 31, 2008, totaled
$5.3 billion compared with $4.2 billion at December 31, 2007,
representing our best estimate of probable losses inherent in the
portfolio and reflecting the then current credit and economic
environment. Allowance for losses increased $1.1 billion from
December 31, 2007, primarily because of increasing delinquencies
and nonearning receivables reflecting the continued weakened
economic and credit environment. Coincident with the changes in
the environment, we saw a significant increase in delinquencies
in the latter half of 2008, particularly in the fourth quarter. As the
environment worsened in the latter half of the year, we recognized
provisions accordingly.