GE 2008 Annual Report Download - page 31
Download and view the complete annual report
Please find page 31 of the 2008 GE annual report below. You can navigate through the pages in the report by either clicking on the pages listed below, or by using the keyword search tool below to find specific information within the annual report.-
 1
1 -
2
-
3
-
4
-
5
-
6
-
7
-
8
-
9
-
10
-
11
-
12
-
13
-
14
-
15
-
16
-
17
-
18
-
19
-
20
-
 21
21 -
 22
22 -
 23
23 -
 24
24 -
 25
25 -
 26
26 -
 27
27 -
 28
28 -
 29
29 -
 30
30 -
 31
31 -
 32
32 -
 33
33 -
 34
34 -
 35
35 -
 36
36 -
 37
37 -
 38
38 -
 39
39 -
 40
40 -
 41
41 -
42
-
43
-
44
-
45
-
46
-
47
-
48
-
49
-
50
-
51
-
52
-
53
-
54
-
55
-
56
-
57
-
58
-
59
-
60
-
61
-
62
-
63
-
64
-
65
-
66
-
67
-
68
-
69
-
70
-
71
-
72
-
73
-
74
-
75
-
76
-
77
-
78
-
79
-
80
-
81
-
82
-
83
-
84
-
85
-
86
-
87
-
88
-
89
-
90
-
91
-
92
-
93
-
94
-
95
-
96
-
97
-
98
-
99
-
100
-
101
-
102
-
103
-
104
-
105
-
106
-
107
-
108
-
109
-
110
-
111
-
112
 |
 |
management’s discussion and analsis
ge 2008 annual report 29
dollar ($0.6 billion). The decrease in net earnings resulted primarily
from core declines ($0.5 billion) and lower securitization income
($0.5 billion). The decreases were partially offset by the gain on
the sale of our CPS business ($0.2 billion), the weaker U.S. dollar
($0.1 billion) and acquisitions ($0.1 billion). Core declines primarily
resulted from lower results in the U.S., reflecting the effects of
higher delinquencies ($1.2 billion), partially offset by growth in
lower-taxed earnings from global operations ($1.0 billion), including
the decision to indefinitely reinvest, outside the U.S., prior-year
earnings.
GE Money 2007 revenues and net earnings increased 27%
and 32%, respectively, compared with 2006. Revenues in 2007
included $0.4 billion from acquisitions. Revenues in 2007 also
increased $4.8 billion as a result of organic revenue growth
($3.5 billion) and the weaker U.S. dollar ($1.4 billion). The increase
in net earnings resulted primarily from core growth ($0.3 billion),
higher securitization income ($0.4 billion), the sale of part of our
Garanti investment ($0.2 billion) and the weaker U.S. dollar
($0.2 billion). Core growth included growth in lower-taxed earn-
ings from global operations ($0.3 billion), partially offset by lower
results in the U.S., reflecting the effects of higher delinquencies
($0.4 billion).
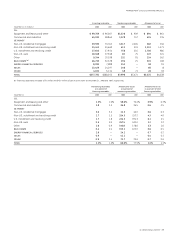
Real Estate 2008 revenues decreased 5% and net earnings
decreased 50% compared with 2007. Revenues for 2008 included
$0.3 billion from acquisitions. Revenues in 2008 also decreased
$0.7 billion compared with 2007 as a result of organic revenue
declines ($0.8 billion), partially offset by the weaker U.S. dollar
($0.2 billion). Real Estate net earnings decreased $1.1 billion
compared with 2007, primarily from a decline in net earnings
from real estate equity investments ($1.2 billion), partially offset
by an increase in net earnings from real estate lending. Net
earnings from the sale of real estate equity investments in 2008
were lower as a result of increasingly difficult market conditions.
In the normal course of our business operations, we sell certain
real estate equity investments when it is economically advanta-
geous for us to do so. However, as a result of deterioration in
current and expected real estate market liquidity and macro-
economic trends, it is difficult to predict with certainty the level
of future sales or sales prices.
Real Estate assets at December 31, 2008, increased $6.0 billion,
or 8%, from December 31, 2007, including $12.1 billion, or 34%,
attributable to an increase in real estate lending, partially offset
by a $6.4 billion, or 16%, decline in real estate equity investments.
During 2008, we sold real estate equity investment assets with a
book value totaling $5.8 billion, which resulted in net earnings of
$1.3 billion that were partially offset by losses, impairments and
depreciation.
Real Estate 2007 revenues and net earnings increased 40%
and 24%, respectively, compared with 2006. Revenues in 2007
included $0.3 billion from acquisitions. Revenues in 2007 also
increased $1.8 billion as a result of organic revenue growth
($1.5 billion) and the weaker U.S. dollar ($0.2 billion). Real Estate
net earnings increased 24% compared with 2006, primarily as a
result of a $0.5 billion increase in net earnings from sales of real
estate investments.
Capital Finance 2007 revenues and net earnings both
increased 18%, compared with 2006. Revenues in 2007 included
$3.5 billion from acquisitions and were reduced by $2.7 billion as a
result of dispositions. Revenues in 2007 also increased $9.1 billion
as a result of organic revenue growth ($6.8 billion) and the weaker
U.S. dollar ($2.3 billion). The increase in net earnings resulted
primarily from core growth ($1.0 billion), higher securitization
income ($0.4 billion) and the weaker U.S. dollar ($0.3 billion). Core
growth included $0.5 billion representing the total year’s tax
benefit on the disposition of our investment in SES, growth in
lower-taxed earnings from global operations ($0.4 billion) and the
sale of part of our Garanti investment ($0.2 billion), partially offset
by declines in fair value of retained interests in securitizations
($0.2 billion). See Corporate Items and Eliminations for a discussion
of items not allocated to this segment.
Additional information about certain Capital Finance businesses
follows.
CLL 2008 revenues decreased 2% and net earnings decreased
53% compared with 2007. Revenues in 2008 and 2007 included
$1.8 billion and $0.2 billion, respectively, from acquisitions, and in
2008 were reduced by $0.3 billion as a result of dispositions.
Revenues in 2008 decreased $1.9 billion compared with 2007 as
a result of organic revenue declines ($2.3 billion), partially offset
by the weaker U.S. dollar ($0.5 billion). Net earnings decreased by
$2.0 billion in 2008, resulting from core declines ($2.2 billion),
including an increase of $0.5 billion in the provision for losses on
financing receivables and lower investment income ($0.3 billion),
partially offset by acquisitions ($0.4 billion) and the effect of the
weaker U.S. dollar ($0.1 billion). Net earnings included mark-to-
market losses and impairments ($0.8 billion), the absence of the
effects of the 2007 tax benefit on the disposition of our investment
in SES ($0.5 billion) and SES gains ($0.1 billion), partially offset by
Genpact mark-to-market gains ($0.2 billion).
CLL 2007 revenues and net earnings increased 6% and 9%,
respectively, compared with 2006. Revenues in 2007 and 2006
included $2.1 billion and $0.1 billion, respectively, from acquisi-
tions, and in 2007 were reduced by $2.7 billion as a result of
dispositions. Revenues in 2007 also increased $1.9 billion as a
result of organic revenue growth ($1.2 billion) and the weaker
U.S. dollar ($0.7 billion). The increase in net earnings resulted
from acquisitions ($0.2 billion), core growth ($0.1 billion) and the
weaker U.S. dollar ($0.1 billion), partially offset by dispositions
($0.1 billion). Core growth included $0.5 billion representing the
total year’s tax benefit on the disposition of our investment in
SES, partially offset by $0.2 billion of higher credit losses and
$0.1 billion in charges related to mark-to-market adjustments to
loans held-for-sale. Investment income included higher SES gains
($0.1 billion), offset by impairments of securitization retained
interests ($0.1 billion).
GE Money 2008 revenues increased 1% and net earnings
decreased 14% compared with 2007. Revenues for 2008 included
$0.7 billion from acquisitions and $0.4 billion from the gain on
sale of our Corporate Payment Services (CPS) business and were
reduced by $0.2 billion from dispositions. Revenues in 2008 also
decreased $0.6 billion compared with 2007 as a result of organic
revenue declines ($1.2 billion), partially offset by the weaker U.S.