GE 2008 Annual Report Download - page 51
Download and view the complete annual report
Please find page 51 of the 2008 GE annual report below. You can navigate through the pages in the report by either clicking on the pages listed below, or by using the keyword search tool below to find specific information within the annual report.-
 1
1 -
2
-
3
-
4
-
5
-
6
-
7
-
8
-
9
-
10
-
11
-
12
-
13
-
14
-
15
-
16
-
17
-
18
-
19
-
20
-
21
-
22
-
23
-
24
-
25
-
26
-
27
-
28
-
29
-
30
-
31
-
32
-
33
-
34
-
35
-
36
-
37
-
38
-
39
-
40
-
 41
41 -
 42
42 -
 43
43 -
 44
44 -
 45
45 -
 46
46 -
 47
47 -
 48
48 -
 49
49 -
 50
50 -
 51
51 -
 52
52 -
 53
53 -
 54
54 -
 55
55 -
 56
56 -
 57
57 -
 58
58 -
 59
59 -
 60
60 -
 61
61 -
62
-
63
-
64
-
65
-
66
-
67
-
68
-
69
-
70
-
71
-
72
-
73
-
74
-
75
-
76
-
77
-
78
-
79
-
80
-
81
-
82
-
83
-
84
-
85
-
86
-
87
-
88
-
89
-
90
-
91
-
92
-
93
-
94
-
95
-
96
-
97
-
98
-
99
-
100
-
101
-
102
-
103
-
104
-
105
-
106
-
107
-
108
-
109
-
110
-
111
-
112
 |
 |

management’s discussion and analsis
ge 2008 annual report 49
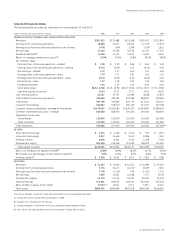
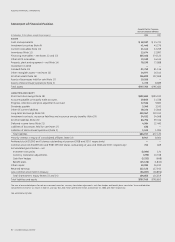
Selected Financial Data.
The following table provides key information for Consolidated, GE and GECS.
(Dollars in millions; per-share amounts in dollars) 2008 2007 2006 2005 2004
GENERAL ELECTRIC COMPANY AND CONSOLIDATED AFFILIATES
Revenues $182,515 $172,488 $151,568 $136,262 $123,814
Earnings from continuing operations 18,089 22,457 19,344 17,279 15,591
Earnings (loss) from discontinued operations, net of taxes (679) (249) 1,398 (559) 1,631
Net earnings 17,410 22,208 20,742 16,720 17,222
Dividends declared(a) 12,649 11,713 10,675 9,647 8,594
Return on average shareowners’ equity(b) 15.9% 20.4% 19.8% 18.1% 18.8%
Per common share
Earnings from continuing operations— diluted $ 1.78 $ 2.20 $ 1.86 $ 1.63 $ 1.49
Earnings (loss) from discontinued operations— diluted (0.07) (0.02) 0.13 (0.05) 0.16
Net earnings — diluted 1.72 2.17 2.00 1.57 1.65
Earnings from continuing operations— basic 1.79 2.21 1.87 1.63 1.50
Earnings (loss) from discontinued operations— basic (0.07) (0.02) 0.14 (0.05) 0.16
Net earnings — basic 1.72 2.18 2.00 1.58 1.66
Dividends declared 1.24 1.15 1.03 0.91 0.82
Stock price range 38.52–12.58 42.15–33.90 38.49–32.06 37.34–32.67 37.75–28.88
Year-end closing stock price 16.20 37.07 37.21 35.05 36.50
Cash and equivalents 48,187 15,731 14,086 8,608 11,833
Total assets of continuing operations 796,046 786,794 674,966 588,821 578,560
Total assets 797,769 795,683 697,273 673,210 750,252
Long-term borrowings 330,067 319,013 260,749 212,167 207,784
Common shares outstanding— average (in thousands) 10,079,923 10,182,083 10,359,320 10,569,805 10,399,629
Common shareowner accounts— average 604,000 608,000 624,000 634,000 658,000
Employees at year end
United States 152,000 155,000 155,000 161,000 165,000
Other countries 171,000 172,000 164,000 155,000 142,000
Total employees 323,000 327,000 319,000 316,000 307,000(c)
GE DATA
Short-term borrowings $ 2,375 $ 4,106 $ 2,076 $ 972 $ 3,252
Long-term borrowings 9,827 11,656 9,043 8,986 7,561
Minority interest 6,678 6,503 5,544 5,308 7,236
Shareowners’ equity 104,665 115,559 111,509 108,633 110,181
Total capital invested $123,545 $137,824 $128,172 $123,899 $128,230
Return on average total capital invested(b) 14.8% 18.9% 18.5% 16.7% 16.9%
Borrowings as a percentage of total capital invested(b) 9.9% 11.4% 8.7% 8.0% 9.0%
Working capital (b) $ 3,904 $ 6,433 $ 7,527 $ 7,853 $ 7,788
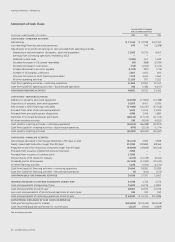
GECS DATA
Revenues $ 71,287 $ 71,936 $ 61,351 $ 54,889 $ 50,320
Earnings from continuing operations 7,774 12,417 10,219 8,929 7,614
Earnings (loss) from discontinued operations, net of taxes (719) (2,116) 439 (1,352) 1,114
Net earnings 7,055 10,301 10,658 7,577 8,728
Shareowner’s equity 53,279 57,676 54,097 50,812 54,379
Total borrowings 514,601 500,922 426,262 362,042 355,463
Ratio of debt to equity at GE Capital 8.76:1(d) 8.10:1 7.52:1 7.09:1 6.45:1
Total assets $660,902 $646,485 $565,258 $540,584 $618,614
Transactions between GE and GECS have been eliminated from the consolidated information.
(a) Includes $75 million of preferred stock dividends in 2008.
(b) Indicates terms are defined in the Glossary.
(c) Includes employees of Genworth, which was subsequently deconsolidated in 2005.
(d) 7.07:1 net of cash and equivalents and with classification of hybrid debt as equity.