GE 2008 Annual Report Download - page 103
Download and view the complete annual report
Please find page 103 of the 2008 GE annual report below. You can navigate through the pages in the report by either clicking on the pages listed below, or by using the keyword search tool below to find specific information within the annual report.-
 1
1 -
2
-
3
-
4
-
5
-
6
-
7
-
8
-
9
-
10
-
11
-
12
-
13
-
14
-
15
-
16
-
17
-
18
-
19
-
20
-
21
-
22
-
23
-
24
-
25
-
26
-
27
-
28
-
29
-
30
-
31
-
32
-
33
-
34
-
35
-
36
-
37
-
38
-
39
-
40
-
41
-
42
-
43
-
44
-
45
-
46
-
47
-
48
-
49
-
50
-
51
-
52
-
53
-
54
-
55
-
56
-
57
-
58
-
59
-
60
-
61
-
62
-
63
-
64
-
65
-
66
-
67
-
68
-
69
-
70
-
71
-
72
-
73
-
74
-
75
-
76
-
77
-
78
-
79
-
80
-
81
-
82
-
83
-
84
-
85
-
86
-
87
-
88
-
89
-
90
-
91
-
92
-
 93
93 -
 94
94 -
 95
95 -
 96
96 -
 97
97 -
 98
98 -
 99
99 -
 100
100 -
 101
101 -
 102
102 -
 103
103 -
 104
104 -
 105
105 -
 106
106 -
 107
107 -
 108
108 -
 109
109 -
 110
110 -
 111
111 -
 112
112
 |
 |

ge 2008 annual report 101
notes to consolidated financial statements
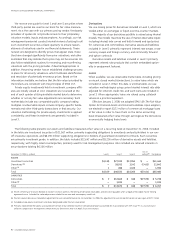
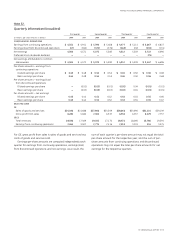
Note 32.
Quarterly Information (Unaudited)
First quarter Second quarter Third quarter Fourth quarter
(In millions; per-share amounts in dollars) 2008 2007 2008 2007 2008 2007 2008 2007
CONSOLIDATED OPERATIONS
Earnings from continuing operations $ 4,351 $ 4,911 $ 5,394 $ 5,608 $ 4,477 $ 5,111 $ 3,867 $ 6,827
Earnings (loss) from discontinued operations (47) (340) (322) (226) (165) 448 (145) (131)
Net earnings 4,304 4,571 5,072 5,382 4,312 5,559 3,722 6,696
Preferred stock dividends declared ——————(75) —
Net earnings attributable to common
shareowners $ 4,304 $ 4,571 $ 5,072 $ 5,382 $ 4,312 $ 5,559 $ 3,647 $ 6,696
Per-share amounts —earnings from
continuing operations
Diluted earnings per share $ 0.43 $ 0.48 $ 0.54 $ 0.54 $ 0.45 $ 0.50 $ 0.36 $ 0.68
Basic earnings per share 0.44 0.48 0.54 0.55 0.45 0.50 0.36 0.68
Per-share amounts —earnings (loss)
from discontinued operations
Diluted earnings per share —(0.03) (0.03) (0.02) (0.02) 0.04 (0.01) (0.01)
Basic earnings per share —(0.03) (0.03) (0.02) (0.02) 0.04 (0.01) (0.01)
Per-share amounts —net earnings
Diluted earnings per share 0.43 0.44 0.51 0.52 0.43 0.54 0.35 0.66
Basic earnings per share 0.43 0.44 0.51 0.52 0.43 0.55 0.35 0.67
SELECTED DATA
GE
Sales of goods and services $24,186 $21,688 $27,846 $24,269 $28,868 $24,690 $31,114 $29,149
Gross profit from sales 6,280 5,660 7,302 6,537 6,930 6,357 8,229 7,757
GECS
Total revenues 18,038 17,409 19,032 17,170 18,431 18,066 15,786 19,291
Earnings from continuing operations 2,456 3,407 2,774 2,416 2,010 3,219 534 3,375
For GE, gross profit from sales is sales of goods and services less
costs of goods and services sold.
Earnings-per-share amounts are computed independently each
quarter for earnings from continuing operations, earnings (loss)
from discontinued operations and net earnings. As a result, the
sum of each quarter’s per-share amount may not equal the total
per-share amount for the respective year; and the sum of per-
share amounts from continuing operations and discontinued
operations may not equal the total per-share amounts for net
earnings for the respective quarters.