GE 2008 Annual Report Download - page 42
Download and view the complete annual report
Please find page 42 of the 2008 GE annual report below. You can navigate through the pages in the report by either clicking on the pages listed below, or by using the keyword search tool below to find specific information within the annual report.-
 1
1 -
2
-
3
-
4
-
5
-
6
-
7
-
8
-
9
-
10
-
11
-
12
-
13
-
14
-
15
-
16
-
17
-
18
-
19
-
20
-
21
-
22
-
23
-
24
-
25
-
26
-
27
-
28
-
29
-
30
-
31
-
 32
32 -
 33
33 -
 34
34 -
 35
35 -
 36
36 -
 37
37 -
 38
38 -
 39
39 -
 40
40 -
 41
41 -
 42
42 -
 43
43 -
 44
44 -
 45
45 -
 46
46 -
 47
47 -
 48
48 -
 49
49 -
 50
50 -
 51
51 -
 52
52 -
53
-
54
-
55
-
56
-
57
-
58
-
59
-
60
-
61
-
62
-
63
-
64
-
65
-
66
-
67
-
68
-
69
-
70
-
71
-
72
-
73
-
74
-
75
-
76
-
77
-
78
-
79
-
80
-
81
-
82
-
83
-
84
-
85
-
86
-
87
-
88
-
89
-
90
-
91
-
92
-
93
-
94
-
95
-
96
-
97
-
98
-
99
-
100
-
101
-
102
-
103
-
104
-
105
-
106
-
107
-
108
-
109
-
110
-
111
-
112
 |
 |
management’s discussion and analsis
40 ge 2008 annual report
As discussed in the previous Liquidity and Borrowings section, in
the fourth quarter of 2008 we took a number of actions to
strengthen our liquidity, maintain our dividend and maintain the
highest credit ratings on our borrowing capability. Actions that
were taken that affected our 2008 shareowners’ equity included:
Þ We raised $12.0 billion from the issuance of 547.8 million shares
of common stock at an issuance price of $22.25 per share.
Þ We issued 30,000 shares of preferred stock and related
warrants for $3.0 billion in proceeds.
Þ We suspended our share repurchase program.
As a result of these actions, Other Capital increased by
$14.3 billion in 2008, compared with increases of $0.6 billion
and $0.3 billion in 2007 and 2006, respectively.
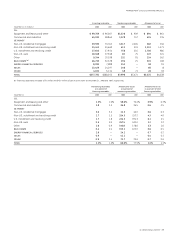
Overview of Our Cash Flow from 2006 through 2008
Consolidated cash and equivalents were $48.2 billion at
December 31, 2008, an increase of $32.5 billion from
December 31, 2007. Cash and equivalents amounted to
$15.7 billion at December 31, 2007, an increase of $1.6 billion
from December 31, 2006.
We evaluate our cash flow performance by reviewing our
industrial (non-financial services) businesses and financial services
businesses separately. Cash from operating activities (CFOA) is the
principal source of cash generation for our industrial businesses.
The industrial businesses also have liquidity available via the
public capital markets. Our financial services businesses use a
variety of financial resources to meet our capital needs. Cash
for financial services businesses is primarily provided from the
issuance of term debt and commercial paper in the public and
private markets, as well as financing receivables collections,
sales and securitizations.
GE Cash Flow
GE CFOA is a useful measure of performance for our non-finan-
cial businesses and totaled $19.1 billion in 2008, $23.3 billion in
2007 and $23.8 billion in 2006. Generally, factors that affect our
earnings —for example, pricing, volume, costs and productivity —
affect CFOA similarly. However, while management of working
capital, including timing of collections and payments and levels
of inventory, affects operating results only indirectly, the effect
of these programs on CFOA can be significant.
Our GE Statement of Cash Flows shows CFOA in the required
format. While that display is of some use in analyzing how various
assets and liabilities affected our year-end cash positions, we
believe that it is also useful to supplement that display and to
examine in a broader context the business activities that provide
and require cash.
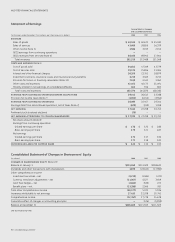
Consolidated Statement of Changes in Shareowners’ Equity
Shareowners’ equity decreased by $10.9 billion in 2008, compared
with increases of $4.1 billion and $2.9 billion in 2007 and 2006,
respectively.
Over the three-year period, net earnings increased equity by
$17.4 billion, $22.2 billion and $20.7 billion, partially offset by
dividends declared of $12.6 billion, $11.7 billion and $10.7 billion
in 2008, 2007 and 2006, respectively.
Elements of Other Comprehensive Income reduced share-
owners’ equity by $30.2 billion in 2008, compared with increases
of $5.1 billion and $0.1 billion in 2007 and 2006, respectively,
inclusive of changes in accounting principles. The components
of these changes are as follows:
Þ Changes in benefit plans reduced shareowners’ equity by
$13.3 billion in 2008, reflecting declines in the fair value of
plan assets as a result of market conditions and adverse
changes in the economic environment. This compared with
increases of $2.6 billion and $0.3 billion in 2007 and 2006,
respectively. In addition, adoption of SFAS 158, Employers’
Accounting for Defined Benefit Pension and Other Postretirement
Plans, at December 31, 2006, reduced shareowners’ equity
by $3.8 billion. Further information about changes in benefit
plans is provided in Note 6.
Þ Currency translation adjustments decreased shareowners’
equity by $11.0 billion in 2008 and increased equity by
$4.5 billion and $3.6 billion in 2007 and 2006, respectively.
Changes in currency translation adjustments reflect the effects
of changes in currency exchange rates on our net investment
in non-U.S. subsidiaries that have functional currencies other
than the U.S. dollar. At the end of 2008, the U.S. dollar was
stronger against most major currencies, including the pound
sterling, the Australian dollar and the euro, compared with a
weaker dollar against those currencies at the end of 2007
and 2006. The dollar was weaker against the Japanese yen in
2008 and 2007.
Þ Net unrealized losses on investment securities reduced share-
owners’ equity by $3.2 billion in 2008, reflecting adverse
market conditions on the fair value of securities classified as
available for sale, primarily corporate debt and mortgage-
backed securities. The change in fair value of investment
securities decreased shareowners’ equity by $1.5 billion and
$0.2 billion in 2007 and 2006, respectively. Further information
about investment securities is provided in Note 9.
Þ Changes in the fair value of derivatives designated as cash
flow hedges decreased shareowners’ equity by $2.7 billion in
2008, primarily reflecting the effect of lower interest rates on
interest rate and currency swaps. The change in the fair value
of derivatives designated as cash flow hedges decreased equity
by $0.5 billion in 2007 and increased equity by $0.2 billion in
2006. Further information about the fair value of derivatives
is provided in Note 29.