Frontier Airlines 2006 Annual Report Download - page 62
Download and view the complete annual report
Please find page 62 of the 2006 Frontier Airlines annual report below. You can navigate through the pages in the report by either clicking on the pages listed below, or by using the keyword search tool below to find specific information within the annual report.-
 1
1 -
2
-
3
-
4
-
5
-
6
-
7
-
8
-
9
-
10
-
11
-
12
-
13
-
14
-
15
-
16
-
17
-
18
-
19
-
20
-
21
-
22
-
23
-
24
-
25
-
26
-
27
-
28
-
29
-
30
-
31
-
32
-
33
-
34
-
35
-
36
-
37
-
38
-
39
-
40
-
41
-
42
-
43
-
44
-
45
-
46
-
47
-
48
-
49
-
50
-
51
-
 52
52 -
 53
53 -
 54
54 -
 55
55 -
 56
56 -
 57
57 -
 58
58 -
 59
59 -
 60
60 -
 61
61 -
 62
62 -
 63
63 -
 64
64 -
 65
65 -
 66
66 -
 67
67 -
 68
68 -
 69
69 -
 70
70 -
 71
71 -
 72
72 -
73
-
74
-
75
-
76
-
77
-
78
-
79
-
80
-
81
-
82
-
83
-
84
-
85
-
86
-
87
-
88
-
89
-
90
-
91
-
92
-
93
-
94
-
95
-
96
-
97
-
98
-
99
-
100
-
101
-
102
-
103
-
104
-
105
-
106
-
107
-
108
-
109
-
110
-
111
-
112
-
113
-
114
-
115
-
116
-
117
-
118
-
119
-
120
-
121
-
122
-
123
-
124
-
125
-
126
-
127
-
128
-
129
-
130
-
131
-
132
-
133
-
134
-
135
-
136
-
137
-
138
-
139
-
140
-
141
-
142
-
143
-
144
-
145
-
146
-
147
-
148
-
149
-
150
-
151
-
152
-
153
-
154
-
155
-
156
-
157
-
158
-
159
-
160
-
161
-
162
-
163
-
164
-
165
-
166
-
167
-
168
-
169
-
170
-
171
-
172
-
173
-
174
-
175
-
176
-
177
-
178
-
179
-
180
-
181
-
182
-
183
-
184
-
185
-
186
-
187
-
188
-
189
-
190
-
191
-
192
-
193
-
194
-
195
-
196
-
197
-
198
-
199
-
200
-
201
-
202
-
203
-
204
-
205
-
206
-
207
-
208
-
209
-
210
-
211
-
212
-
213
-
214
-
215
-
216
-
217
-
218
-
219
-
220
-
221
-
222
-
223
-
224
-
225
-
226
-
227
-
228
-
229
-
230
-
231
-
232
-
233
-
234
-
235
-
236
-
237
-
238
-
239
-
240
-
241
-
242
-
243
-
244
-
245
-
246
-
247
-
248
-
249
-
250
-
251
-
252
-
253
-
254
-
255
-
256
-
257
-
258
-
259
-
260
-
261
-
262
-
263
-
264
-
265
-
266
-
267
-
268
-
269
-
270
-
271
-
272
-
273
-
274
-
275
-
276
-
277
-
278
-
279
-
280
-
281
-
282
-
283
-
284
-
285
-
286
-
287
-
288
-
289
-
290
-
291
-
292
-
293
-
294
-
295
-
296
-
297
-
298
-
299
-
300
-
301
-
302
-
303
-
304
-
305
-
306
-
307
-
308
-
309
-
310
-
311
-
312
-
313
 |
 |

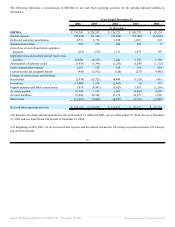
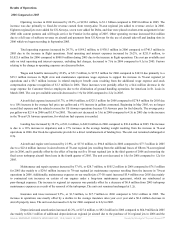
Results of Operations
2006 Compared to 2005
Operating revenue in 2006 increased by 26.3%, or $238.1 million, to $1.1 billion compared to $905.0 million in 2005. The
increase was due primarily to fixed-fee revenue earned from twenty-nine 70-seat regional jets added to revenue service in 2006.
Eighteen regional jets were added for US Airways, seven were added for Delta, and four were placed on short-term assignment in late
2006 with current partners and will begin service for Frontier in the spring of 2007. Other operating revenue increased $6.4 million
due to a full year of sublease revenue on aircraft and payments from US Airways for the use of aircraft take-off and landing slots in
2006 which we began recording in September 2005.
Total operating expenses increased by 24.7%, or $184.2 million, to $ 930.5 million in 2006 compared to $746.3 million in
2005 due to the increase in flight operations. Total operating and interest expenses increased by 26.2%, or $211.9 million, to
$1,021.6 million for 2006 compared to $809.8 million during 2005 due to the increase in flight operations. The cost per available seat
mile on total operating and interest expenses, excluding fuel charges, decreased to 7.6¢ in 2006 compared to 8.1¢ in 2005. Factors
relating to the change in operating expenses are discussed below.
Wages and benefits increased by 22.0%, or $31.7 million, to $175.5 million for 2006 compared to $143.8 due primarily to a
$25.3 million increase in flight crew and maintenance operations wage expenses to support the increase in 70-seat regional jet
operations and a $8.7 million increase in related employee benefit costs resulting from the additional wage expense and stock
compensation expense recognition of $1.3 million in 2006. These increases were partially offset by a $4.4 million decrease in the
wage expense for Customer Service employees due to the elimination of ground handling operations for American in St. Louis in
March 2006. The cost per available seat mile decreased to 1.9¢ for 2006 compared to 2.2¢ in 2005.
Aircraft fuel expense increased 16.7%, or $46.6 million, to $325.5 million for 2006 compared to $278.9 million for 2005 due
to a 10% increase in the average fuel price per gallon and a 6% increase in gallons consumed. Beginning in May 2005, we no longer
record fuel expense and the related revenue for US Airways operations because US Airways pays for fuel directly. The average price
per gallon was $2.16 in 2006 and $1.97 in 2005. The unit cost decreased to 3.6¢ in 2006 compared to 4.3¢ in 2005 due to the increase
in the 70-seat US Airways operations, for which no fuel expense is recorded.
Landing fees increased by 38.2%, or $11.6 million, to $42.0 million in 2006 compared to $30.4 million in 2005. The increase
is due to a 16% increase in departures and a 17% increase in the average landing weight resulting from the increase in 70-seat
operations in 2006. Our fixed-fee agreements provide for a direct reimbursement of landing fees. The unit cost remained unchanged at
0.5¢.
Aircraft and engine rent increased by 21.9%, or $17.0 million, to $94.8 million in 2006 compared to $77.7 million in 2005
due to a $22.4 million increase in aircraft rents of 70-seat regional jets resulting from the additional leases of fifteen 70-seat regional
jets in 2006, and is partially offset by the effect of buying out five 50-seat regional jets in the third quarter of 2006 and removing the
final seven turboprop aircraft from lease in the fourth quarter of 2005. The unit cost decreased to 1.0¢ for 2006 compared to 1.2¢ for
2005.
Maintenance and repair expenses increased by 37.6%, or $28.7 million, to $105.2 million in 2006 compared to $76.5 million
for 2005 due mainly to a $29.6 million increase in 70-seat regional jet maintenance expenses resulting from the increase in 70-seat
operations in 2006. Additionally, maintenance expenses on our smaller jets (37-50 seats) increased $5.4 million over 2005 due mainly
to contractual rate increases on certain of our engines under a long-term maintenance agreement, which are reimbursed as
pass-through expenses. The increase in regional jet expenses was partially offset by a decrease of $6.4 million from 2005 turboprop
maintenance expenses as a result of the removal of the turboprops. The unit cost remained unchanged at 1.2¢.
Insurance and taxes increased 9.5%, or $1.5 million, to $17.7 million in 2006 compared to $16.1 million in 2005. The
increase in operations was mostly offset by a decline in the average insurance rates year over year and a $0.4 million decrease in
aircraft property taxes. The unit cost decreased to 0.2¢ for 2006 compared to 0.3¢ in 2005.
Depreciation and amortization increased 42.2%, or $27.4 million, to $92.2 million in 2006 compared to $64.9 million in 2005
due mainly to $24.1 million of additional depreciation on regional jet aircraft due to the purchase of 16 regional jets in 2006 and the
Source: REPUBLIC AIRWAYS HOLDINGS INC, 10-K, March 15, 2007 Powered by Morningstar® Document Research℠