Frontier Airlines 2006 Annual Report Download - page 55
Download and view the complete annual report
Please find page 55 of the 2006 Frontier Airlines annual report below. You can navigate through the pages in the report by either clicking on the pages listed below, or by using the keyword search tool below to find specific information within the annual report.-
 1
1 -
2
-
3
-
4
-
5
-
6
-
7
-
8
-
9
-
10
-
11
-
12
-
13
-
14
-
15
-
16
-
17
-
18
-
19
-
20
-
21
-
22
-
23
-
24
-
25
-
26
-
27
-
28
-
29
-
30
-
31
-
32
-
33
-
34
-
35
-
36
-
37
-
38
-
39
-
40
-
41
-
42
-
43
-
44
-
 45
45 -
 46
46 -
 47
47 -
 48
48 -
 49
49 -
 50
50 -
 51
51 -
 52
52 -
 53
53 -
 54
54 -
 55
55 -
 56
56 -
 57
57 -
 58
58 -
 59
59 -
 60
60 -
 61
61 -
 62
62 -
 63
63 -
 64
64 -
 65
65 -
66
-
67
-
68
-
69
-
70
-
71
-
72
-
73
-
74
-
75
-
76
-
77
-
78
-
79
-
80
-
81
-
82
-
83
-
84
-
85
-
86
-
87
-
88
-
89
-
90
-
91
-
92
-
93
-
94
-
95
-
96
-
97
-
98
-
99
-
100
-
101
-
102
-
103
-
104
-
105
-
106
-
107
-
108
-
109
-
110
-
111
-
112
-
113
-
114
-
115
-
116
-
117
-
118
-
119
-
120
-
121
-
122
-
123
-
124
-
125
-
126
-
127
-
128
-
129
-
130
-
131
-
132
-
133
-
134
-
135
-
136
-
137
-
138
-
139
-
140
-
141
-
142
-
143
-
144
-
145
-
146
-
147
-
148
-
149
-
150
-
151
-
152
-
153
-
154
-
155
-
156
-
157
-
158
-
159
-
160
-
161
-
162
-
163
-
164
-
165
-
166
-
167
-
168
-
169
-
170
-
171
-
172
-
173
-
174
-
175
-
176
-
177
-
178
-
179
-
180
-
181
-
182
-
183
-
184
-
185
-
186
-
187
-
188
-
189
-
190
-
191
-
192
-
193
-
194
-
195
-
196
-
197
-
198
-
199
-
200
-
201
-
202
-
203
-
204
-
205
-
206
-
207
-
208
-
209
-
210
-
211
-
212
-
213
-
214
-
215
-
216
-
217
-
218
-
219
-
220
-
221
-
222
-
223
-
224
-
225
-
226
-
227
-
228
-
229
-
230
-
231
-
232
-
233
-
234
-
235
-
236
-
237
-
238
-
239
-
240
-
241
-
242
-
243
-
244
-
245
-
246
-
247
-
248
-
249
-
250
-
251
-
252
-
253
-
254
-
255
-
256
-
257
-
258
-
259
-
260
-
261
-
262
-
263
-
264
-
265
-
266
-
267
-
268
-
269
-
270
-
271
-
272
-
273
-
274
-
275
-
276
-
277
-
278
-
279
-
280
-
281
-
282
-
283
-
284
-
285
-
286
-
287
-
288
-
289
-
290
-
291
-
292
-
293
-
294
-
295
-
296
-
297
-
298
-
299
-
300
-
301
-
302
-
303
-
304
-
305
-
306
-
307
-
308
-
309
-
310
-
311
-
312
-
313
 |
 |

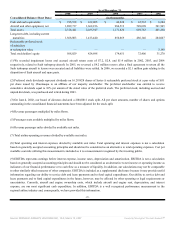
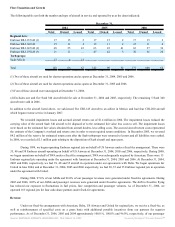
Fleet Transition and Growth
The following table sets forth the number and type of aircraft in service and operated by us at the dates indicated:
December 31,
2004 2005 2006
Total Owned Leased Total Owned Leased Total Owned Leased
Regional Jets:
Embraer ERJ-135 LR (1) 17 15 2 17 15 2 17 15 2
Embraer ERJ-140 LR 15 11 4 15 11 4 15 11 4
Embraer ERJ-145 LR (2) 68 25 43 63 22 41 63 27 36
Embraer ERJ-170 LR (3) 11 11 — 47 42 5 76 56 20
Turboprops:
Saab 340 (4) 17 4 13 — — — — — —
Total 128 66 62 142 90 52 171 109 62
(1) Two of these aircraft are used for charter operations and as spares at December 31, 2004, 2005 and 2006.
(2) Two of these aircraft are used for charter operations and as spares at December 31, 2005 and 2006.
(3) Four of these aircraft were unassigned at December 31, 2006.
(4) Excludes one and five Saab 340 aircraft held for sale at December 31, 2004 and 2005, respectively. The remaining 5 Saab 340
aircraft were sold in 2006.
In addition to the aircraft listed above, we sub-leased five ERJ-145 aircraft to an airline in Mexico and had four CRJ-200 aircraft
which began revenue service in January 2007.
We recorded impairment losses and accrued aircraft return cost of $1.4 million in 2004. The impairment losses reduced the
carrying value of the owned Saab 340 aircraft to be disposed of to the estimated fair value less costs to sell. The impairment losses
were based on the estimated fair values obtained from aircraft dealers, less selling costs. The accrued aircraft return costs represented
the estimate of the Company's overhaul and return costs in order to meet required return conditions. In December 2005, we reversed
$4.2 million of the reserve for estimated return costs after the Saab turboprops were returned to lessors and all liabilities were settled.
In 2006, we recorded a $2.1 million gain relating to the disposition of Saab aircraft and spare parts.
During 1999, we began operating Embraer regional jets on behalf of US Airways under a fixed-fee arrangement. There were
35, 40 and 58 Embraer aircraft operating on behalf of US Airways at December 31, 2004, 2005 and 2006, respectively. During 2000,
we began operations on behalf of TWA under a fixed-fee arrangement; TWA was subsequently acquired by American. There were 15
Embraer regional jets operating under the agreement with American at December 31, 2004, 2005 and 2006. At December 31, 2004,
2005 and 2006, respectively, we had 39, 48 and 55 aircraft in operation under our agreements with Delta. We began operations for
United in June 2004, and at December 31, 2004, 2005 and 2006 respectively, we had 20, 35 and 35 Embraer regional jets in operation
under the agreement with United.
During 2004, 97.6% of our ASMs and 96.0% of our passenger revenues were generated under fixed-fee agreements. During
2005 and 2006, 100% of our ASMs and passenger revenues were generated under fixed-fee agreements. The shift to fixed-fee flying
has reduced our exposure to fluctuations in fuel prices, fare competition and passenger volumes. As of December 31, 2006, we
operated 163 regional jets for four code-share partners under fixed-fee agreements.
Revenue
Under our fixed-fee arrangements with American, Delta, US Airways and United for regional jets, we receive a fixed-fee, as
well as reimbursement of specified costs on a gross basis with additional possible incentives from our partners for superior
performance. As of December 31, 2006, 2005 and 2004 approximately 100.0.%, 100.0% and 96.0%, respectively, of our passenger
Source: REPUBLIC AIRWAYS HOLDINGS INC, 10-K, March 15, 2007 Powered by Morningstar® Document Research℠